CES Savings Report — original pdf
Backup
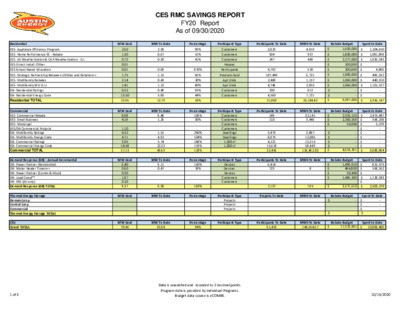
Residential EES- Appliance Efficiency Program EES- Home Performance ES - Rebate EES- AE Weatherization & CAP Weatherization - D.I. EES-Direct Install -Other EES-School Based Education EES- Strategic Partnership Between Utilities and Retailers++ EES- Multifamily Rebates EES- Multifamily WX-D.I.+ GB- Residential Ratings GB- Residential Energy Code Residential TOTAL Commercial EES- Commercial Rebate EES- Small Business EES- Municipal EES/GB Commercial Projects GB- Multifamily Ratings GB- Multifamily Energy Code GB- Commercial Ratings GB- Commercial Energy Code Commercial TOTAL Demand Response (DR) - Annual Incremental DR- Power Partner (Residential) DR- Water Heater Timers++ DR- Power Partner (Comm & Muni) DR- Load Coop** DR- ERS (AE only) Demand Response (DR) TOTAL Thermal Energy Storage Domain Loop Central Loop Commercial Thermal Energy Storage TOTAL CES Grand TOTAL CES RMC SAVINGS REPORT FY20 Report As of 09/30/2020 MW Goal MW To Date Percentage Participant Type Participants To Date MWh To Date Rebate Budget MW Goal MW To Date Percentage Participant Type Participants To Date MWh To Date Rebate Budget 2.60 1.30 0.72 0.01 0.01 1.75 2.14 1.41 0.52 13.50 23.96 8.98 4.19 1.10 0.52 4.71 3.05 14.58 37.13 6.40 0.60 0.30 1.87 0.20 9.37 2.58 0.67 0.30 0.09 1.15 0.43 1.13 0.49 5.90 12.73 9.48 1.26 1.51 4.92 5.74 22.32 43.63 9.11 0.47 9.58 99% 51% 41% 870% 66% 20% 80% 95% 44% 53% 106% 30% 290% 104% 188% 153% 118% 142% 78% 102% Customers Customers Customers Houses Participants Products Sold Apt Units Apt Units Customers Customers Customers Customers Customers Customers Dwellings Dwellings 1,000 sf 1,000 sf Devices Devices Devices Customers Customers Projects Projects Projects 3,823 504 247 4,792 187,449 2,488 4,746 700 4,560 21,860 149 110 3,473 8,875 4,221 15,618 32,456 6,414 723 7,137 26,184.42 4,919 937 443 620 6,721 1,157 2,855 812 7,721 32,141 3,446 3,887 12,086 13,315 58,443 8 118,462.30 $ 1,600,000 $ 1,800,000 $ 2,277,000 $ 100,000 $ 200,000 $ 1,000,000 $ 1,060,000 $ 1,060,000 $ - $ - $ 9,097,000 $ 2,335,123 $ 2,260,168 $ 60,000 $ - $ - $ - $ - $ 4,655,291 $ 1,499,910 $ 494,800 $ 90,400 $ 1,486,500 Spent to Date $ 1,204,650 1,081,898 $ $ 1,026,543 $ - $ $ $ $ $ - $ - $ 4,886 496,532 440,310 1,101,327 5,356,147 Spent to Date $ 2,475,447 $ 558,258 $ 5,279 - $ $ - $ - $ - $ - $ 3,038,984 Spent to Date 816,375 558,552 $ $ $ - $ $ - $ 2,503,270 1,128,343 $ - $ - Spent To Date - $ - $ $ - $ - MW Goal MW To Date Percentage Participant Type Participants To Date MWh To Date Rebate Budget MW Goal MW To Date Percentage Participant Type Projects To Date MWh To Date Rebate Budget 7.95 $ 3,571,610 MW Goal 70.46 MW To Date 65.94 94% Percentage Participant Type Participants To Date 61,453 MWh To Date 144,654.67 Rebate Budget $ 17,323,901 Spent to Date 10,898,400 $ 1 of 3 10/15/2020 Data is unaudited and rounded to 2 decimal points. Program data is provided by individual Programs. Budget data source is eCOMBS. Solar Energy Residential Commercial Solar Energy TOTAL Austin’s solar customers do not always participate in the solar incentive programs. Information shown here is only for incentivized projects. The total amount of solar installed by Austin Energy customers in FY20 is 12.136 MW-ac over a total of 1670 projects. Incentive Budgetǂ $ 3,000,000 $ 2,500,000 $ 5,500,000 Customers Customers Participants To Date 7.65 2.69 10.34 7.00 5.00 12.00 109% 54% 86% Participant Type MWh To Date 12792 4509 MW To Date Percentage 17,301.18 MW Goal 1,239 1,205 34 Spent to Date $ 3,786,585 2,073,602 $ $ 5,860,187 CES RMC SAVINGS REPORT FY20 Report As of 09/30/2020 UPDATE Low Income Energy Efficiency Programs Solar Green Building Approved $59,120 in rebates for solar on 10 low-income households (Father Znotas Street Houses), for a total of 59.120 kW-DC, and an estimated annual energy savings of 86,500 kwh/year. Currently, 7 of the 10 projects have been completed, the rest are expected to reach completion in the coming few weeks. In September, 9 of 26 Single Family homes receiving an AE Green Building rating are in SMART Housing developments in the AE service area. One Multifamily SMART housing development with 120 units received a 1-star rating. EES - LOAD COOP PROGRAM No. of Events 11 No. of Applicants2 Participants /Locations 61 518 Program Capacity3 MW Maximum Event Performance MW 2An additional 28 locations enrolled for 2020 season but showed no participation due to a number of factors including COVID-19 3 Program Capacity is the sum of all participants' best 2020 Load Coop event day performance based on audit information. Includes T&D&SR DR Capacity Program Cycle Saver Free Thermostat Power Partner Thermostat Emergency Response System (AE only) No. of Devices 22,408 11,384 37,984 - Program Capacity (MW) 14.570 11.04* 53.94 0.20 *Numbers based on M&V study summer of 2019. Loan Program EES- Home Performance ES-Loan* *The rebate loan program is used to provide Velocity loans with a reduced interest rate for customers who perform energy efficiency improvements (with approved credit). Program Spend $ 39,690 $ 200,000 Customers 83 Budget Green Building Impacts Credited to Solar Energy Credited to AE Thermal Energy Storage Credited to Solar Energy Natural gas Building water Units MW MW MWh CCF 1,000 gal 0.464 2.325 789.711 269722.000 53378.000 2 of 3 10/15/2020 Data is unaudited and rounded to 2 decimal points. Program data is provided by individual Programs. Budget data source is eCOMBS. CES RMC SAVINGS REPORT FY20 Report As of 09/30/2020 Recipients (OR) Recipients (NL) Visual Analytic Team (OR) Irrigation water Construction Waste diversion 1,000 gal Tons 29663.000 82260.000 EES/GB Water Savings Gallons/yr. at 0.45 Gallon/kWh Avoided power plant water consumption (evaporation only). EES Behavioral Programs PSV Newsletter & Outreach Residential App Commercial App Electric Vehicle Programs August 2020 FY'20 Commercial Charging Stations Residential Charging Stations E-Ride Units Participants Participants Participants 33,229 3,195 Rebates Spent(Current Month) 35 313 378 $ $ $ 280,294.36 224,218.17 131,100.00 NOTES: The Load Coop program does not report final year participation until late October/early November. DR program savings are based on incremental savings, not cumulative. Energy code savings from building permits are reported in the corresponding month one year post permit, thus Energy code savings from FY2019 building permits are reported in FY2020. Annual totals are adjusted for corrections in prior months. Source of financial data for energy efficiency programs is the utility financial reporting system. Source of financial data for solar is the Solar team tracking system for long-range planning and is validated at year-end. Residential participant counts do not include number of bulbs. Commercial participant counts do not include number of square feet. SPUR savings numbers are now audited for the previous month. Therefore, they are reported with a one month delay. Energy code savings from building permits are reported in the corresponding month one year post permit, thus Energy code savings from FY2019 building permits are reported in FY2020. *Currently maintaining existing population of Cycle Saver water heater timers through replacement of units at 10 years. **Numbers based on M&V study summer of 2018. Budget values are obtained from eCOMBS as of 11/1/2018 not including encumbrances for EES programs ǂ Budget for Residential Solar includes incentives and O&M. Multi-program Reconciliation -1.606 Customers 10 -4856.248 3 of 3 10/15/2020 Data is unaudited and rounded to 2 decimal points. Program data is provided by individual Programs. Budget data source is eCOMBS.