Solar Monthly Report — original pdf
Backup
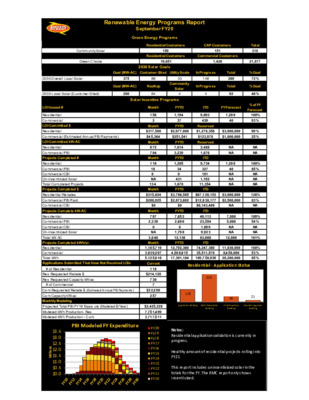
Renewable Energy Programs Report September FY20 Green Energy Programs 159 19,651 2030 Solar Goals Residential Customers CAP Customers Residential Customers Commercial Customers 151 1,426 Community Solar Green Choice 2030 Overall Local Solar 2030 Local Solar (Customer Sited) 375 200 Goal (MW-AC) Customer-Sited Utility Scale In Progress Goal (MW-AC) Rooftop In Progress Community Solar Incentive Programs ITD FY Forecast Commercial (Estimated Annual PBI Payments) LOI Committed kW-AC $2,977,000 $251,541 $3,000,000 $1,000,000 Total 310 21,077 % Goal 72% % Goal 46% % of FY Forecast 100% 93% 99% 25% NA NA 85% NA NA NA 126% 83% NA 109% 54% NA NA 108% 53% 85% 33 Solar 4 FYTD 1,194 37 FYTD FYTD 7,614 3,239 FYTD 1,205 34 0 431 1,670 FYTD $0 FYTD 7,652 2,686 0 1,798 12,136 FYTD 148 4 9,893 439 Reserved $1,278,356 $123,970 Reserved 2,488 1,676 ITD 9,734 327 101 1,192 11,354 ITD ITD 49,113 23,554 1,099 9,923 83,688 ITD Total 269 Total 92 1,200 40 NA NA 40 NA NA NA 7,000 5,000 NA NA $3,786,585 $67,120,152 $3,000,000 $2,073,602 $12,038,177 $2,500,000 $6,143,408 NA 1,200 100% 12,000 101% 12,792,369 4,508,815 74,247,369 35,511,570 11,830,000 8,450,000 17,301,184 109,758,939 20,280,000 Residential - Application Status ITD 118 NA NA NA NA NA 253 NA NA NA NA NA NA NA NA 56 NA NA Pend in g NA NA NA NA NA 21 NA NA Pend in g NA NA NA Application Pending Work Comp letion NA NA NA Pend in g Final Ins pection Payment App roval Notes: Residential application validation is currently in progress. Healthy amount of residential projects rolling into FY21 This report includes unincentivized solar in the totals for the FY. The RMC report only shows incentivized. 88 84 Month 156 2 Month $317,500 $45,364 Month Month $315,824 $200,925 Month 972 704 116 18 0 NA 134 $0 Month 707 2,339 0 NA 3,046 Month 1,185,719 3,939,297 5,125,016 Current $214,120 118 730 7 257 $22,208 $2,425,228 7,751,499 3,717,511 FY20 Fy19 Fy18 FY17 FY16 FY15 FY14 FY13 FY12 FY11 FY10 LOI Issued # Residential Commercial LOI Committed $ Residential Residential Commercial PBI Projects Completed # Residential Commercial PBI Commercial CBI Un-Incentivized Solar Total Completed Projects Projects Completed $ Residential Rebates Commercial PBI Paid Commercial CBI Projects Complete kW-AC Residential Commercial PBI Commercial CBI Un-Incentivized Solar Total kW AC Projects Completed kWh/yr. Residential Commercial Total kWh Applications Submitted That Have Not Received LOIs # of Residential Res Requested Rebate $ Res Requested Capacity kW-ac # of Commercial Com Requested Rebate $ (Estimated Annual PBI Payments) Com Capacity kW-ac Monthly Modeling Projected Total PBI FY18 Exposure (Modeled $/Year) Modeled kWh Production- Res Modeled kWh Production - Com PBI Modeled FY Expenditure s n o i l l i M $3.5 $3.0 $2.5 $2.0 $1.5 $1.0 $0.5 $0.0