Solar Monthly Report — original pdf
Backup
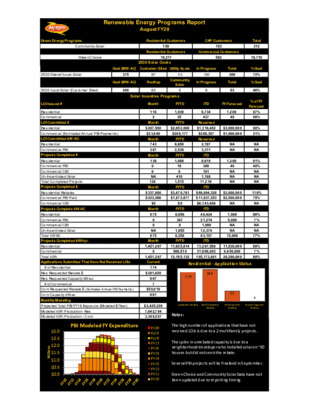
Renewable Energy Programs Report Green Energy Programs Residential Customers CAP Customers Community Solar Green Choice Residential Customers Commercial Customers 153 502 August FY20 159 18,217 2030 Solar Goals 2030 Overall Local Solar 2030 Local Solar (Customer Sited) 375 200 Goal (MW-AC) Customer-Sited Utility Scale In Progress Goal (MW-AC) Rooftop In Progress Community Solar Incentive Programs Commercial (Estimated Annual PBI Payments) LOI Committed kW-AC $287,500 $2,652,000 $1,316,452 $3,000,000 $206,177 $1,000,000 Total 312 18,719 % Goal 72% % Goal 46% 87% 88% 88% 21% NA NA 91% 40% NA NA NA 116% 75% NA 99% 7% NA NA 77% 98% 7% 60% NA NA NA 4 NA NA Pending NA NA ITD FY Forecast % of FY Forecast 33 Solar 4 FYTD 1,039 35 FYTD FYTD 6,659 2,536 FYTD 1,089 16 0 410 1,515 FYTD $0 FYTD 6,956 347 0 1,955 9,258 FYTD Total 269 Total 93 1,200 40 1,200 NA NA 40 NA NA NA 7,000 5,000 NA NA 12,000 150 6 9,734 437 Reserved $266,387 Reserved 2,197 3,311 ITD 9,618 309 101 1,188 11,216 ITD ITD 48,424 21,214 1,099 12,370 83,107 ITD $3,470,761 $66,804,328 $3,000,000 $1,872,677 $11,837,253 $2,500,000 $6,143,408 NA 174 189 NA NA NA NA Application Pending Work Completion NA NA Notes: NA NA NA NA NA NA NA NA Pending NA NA 63 NA NA NA Pending NA NA Final Ins pection Payment Approval The high number of applications that have not received LOIs is due to a 2 multifamily projects. The spike in unrebated capacity is due to a neighborhood developer who installed solar on ~50 houses but did not seek the rebate. Several PBI projects will be finalized in September. Green Choice and Community Solar Data have not been updated due to reporting timing 87 83 Month 118 2 Month $23,849 Month Month 743 307 138 0 0 NA 138 Month $337,000 $223,266 $0 Month 875 NA 875 Month 0 0 0 1,451,297 Current $281,620 174 907 7 991 $2,425,228 7,642,784 3,348,287 FY20 Fy19 Fy18 FY17 FY16 FY15 FY14 FY13 FY12 FY11 FY10 1,451,297 11,625,614 569,518 73,207,598 31,966,203 11,830,000 8,450,000 12,195,132 105,173,801 20,280,000 Residential - Application Status ITD LOI Issued # Residential Commercial LOI Committed $ Residential Residential Commercial PBI Projects Completed # Residential Commercial PBI Commercial CBI Un-Incentivized Solar Total Completed Projects Projects Completed $ Residential Rebates Commercial PBI Paid Commercial CBI Projects Complete kW-AC Residential Commercial PBI Commercial CBI Un-Incentivized Solar Total kW AC Projects Completed kWh/yr. Residential Commercial Com Requested Rebate $ (Estimated Annual PBI Payments) $58,019 Total kWh Applications Submitted That Have Not Received LOIs # of Residential Res Requested Rebate $ Res Requested Capacity kW-ac # of Commercial Com Capacity kW-ac Monthly Modeling Projected Total PBI FY18 Exposure (Modeled $/Year) Modeled kWh Production- Res Modeled kWh Production - Com PBI Modeled FY Expenditure s n o i l l i M $3.0 $2.5 $2.0 $1.5 $1.0 $0.5 $0.0