CES RMC Savings Report — original pdf
Backup
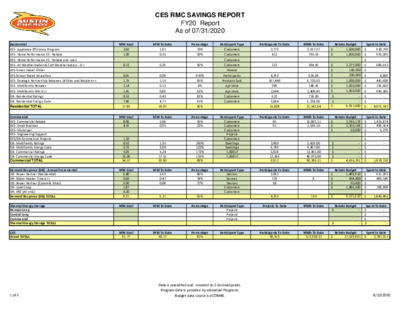
Residential EES- Appliance Efficiency Program EES- Home Performance ES - Rebate EES- Home Performance ES - Rebate and Loan EES- AE Weatherization & CAP Weatherization - D.I. EES-Direct Install -Other EES-School Based Education EES- Strategic Partnership Between Utilities and Retailers++ EES- Multifamily Rebates EES- Multifamily WX-D.I.+ GB- Residential Ratings GB- Residential Energy Code Residential TOTAL Commercial EES- Commercial Rebate EES- Small Business EES- Municipal EES- Engineering Support EES/GB Commercial Projects GB- Multifamily Ratings GB- Multifamily Energy Code GB- Commercial Ratings GB- Commercial Energy Code Commercial TOTAL Demand Response (DR) - Annual Incremental DR- Power Partner (Residential) DR- Water Heater Timers++ DR- Power Partner (Comm & Muni) DR- Load Coop DR- ERS (AE only) Demand Response (DR) TOTAL Thermal Energy Storage Domain Loop Central Loop Commercial Thermal Energy Storage TOTAL CES Grand TOTAL CES RMC SAVINGS REPORT FY20 Report As of 07/31/2020 MW Goal MW To Date Percentage Participant Type Participants To Date MWh To Date Rebate Budget MW Goal MW To Date Percentage Participant Type Participants To Date MWh To Date Rebate Budget 2.60 1.30 0.72 0.01 1.75 2.14 1.41 0.52 7.38 17.83 8.98 4.19 1.10 0.52 3.73 3.05 13.00 34.57 6.40 0.60 0.30 1.87 0.20 9.37 1.81 0.55 0.26 0.09 1.15 0.13 0.89 0.43 4.77 10.07 5.06 0.95 1.35 3.80 5.24 17.51 33.90 5.65 0.47 0.08 6.21 70% 42% 36% 870% 66% 6% 63% 83% 65% 56% 56% 23% 260% 102% 172% 135% 98% 88% 78% 27% 66% Customers Customers Customers Customers Houses Participants Products Sold Apt Units Apt Units Customers Customers Customers Customers Customers Projects Customers Dwellings Dwellings 1,000 sf 1,000 sf Devices Devices Devices Customers Customers Projects Projects Projects 2,773 412 212 4,792 187,449 399 2,944 622 3,684 15,838 96 91 2,980 6,745 3,818 12,566 9,912 3,982 723 58 4,763 3,537.37 765.55 384.56 620.03 6,720.53 148.56 2,408.45 718.00 6,238.00 21,541.04 16,801.11 2,536.10 3,429.00 9,497.00 12,451.00 46,075.00 90,789.21 8 $ 1,600,000 $ 1,800,000 $ 2,277,000 $ 100,000 $ 200,000 $ 1,000,000 $ 1,060,000 $ 1,060,000 $ - $ - $ 9,097,000 $ 2,335,123 $ 2,260,168 $ 60,000 $ - $ - $ - $ - $ 4,655,291 $ 1,499,910 $ 494,800 $ 90,400 $ 1,486,500 688,652 Spent to Date 920,750 $ $ 933,005 $ - $ $ - $ $ $ $ $ - - $ $ 4,886 441,608 136,660 945,586 4,071,147 Spent to Date 1,425,874 439,564 5,279 $ $ $ $ - $ - $ - $ - - $ $ - $ 1,870,718 Spent to Date $ 651,395 485,149 $ $ - $ $ - $ 1,845,452 708,908 $ - $ - Spent To Date $ - $ - $ - $ - MW Goal MW To Date Percentage Participant Type Participants To Date MWh To Date Rebate Budget MW Goal MW To Date Percentage Participant Type Projects To Date MWh To Date Rebate Budget 7.95 $ 3,571,610 MW Goal 61.77 MW To Date 50.17 81% Percentage Participant Type Participants To Date 30,513 MWh To Date 112,338.21 Rebate Budget $ 17,323,901 Spent to Date 7,787,317 $ 1 of 3 8/10/2020 Data is unaudited and rounded to 2 decimal points. Program data is provided by individual Programs. Budget data source is eCOMBS. CES RMC SAVINGS REPORT FY20 Report As of 07/31/2020 Solar Energy Residential Commercial Solar Water Heating Solar Energy TOTAL Low Income Energy Efficiency Programs Solar Green Building MW Goal MW To Date Percentage Participant Type Participants To Date MWh To Date 7.00 5.00 12.00 6.01 0.35 6.36 86% 7% 53% Customers Customers Customers 942 16 958 10062 570 Incentive Budgetǂ $ 3,000,000 $ 2,500,000 10,631.52 $ 5,500,000 Spent to Date 3,109,261 1,649,411 $ $ $ - $ 4,758,672 The Weatherization Assistance Program currently has 315 homes completed or in the pipeline for weatherization. We are currently working with the North Lamar Mobile Home Park to UPDATE provide weatherization services to residents. The solar program initiated the first stages of Shared Solar UAT automated billing this month. In July, 29 of 56 Single Family homes receiving an AE Green Building rating are in SMART Housing developments in the AE service area. Low Income Program EES Weatherization Assistance CAP Weatherization EES - LOAD COOP PROGRAM No. of Events 13 Encumbrances as of 04/11/18 Spent To Date Budget $ 1,377,000 $ 1,000,000 No. of Applicants Participants /Locations 55 474 Program Capacity MW 43.88 Maximum Event Performance MW 2Applicants and locations modified as a result of non performance and failure to activate contracts by end of fiscal year. 3Program Capacity is the sum of all participants' best 2018 Load Coop performance or expected maximum drop based on audit information. Includes T&D&SR. 4Best performance for any one event including 20% T&D&SR multiplier. DR Capacity Program Cycle Saver* Free Thermostat** Power Partner Thermostat Emergency Response System (AE only) EES Behavioral Programs PSV Newsletter & Outreach Residential App Commercial App Electric Vehicle Programs Commercial Charging Stations Residential Charging Stations E-Ride Devices/ Participants 22,408 11,384 35,294 - Units Participants Participants Participants Program Capacity (MW) 14.570 11.04* 50.12 0.20 Count 8,719 32,545 3,179 Rebates Spent To Date 5 28 4 $ $ $ 31,000.00 20,746.29 1,700.00 Loan Program EES- Home Performance ES-Loan* *The rebate loan program is used to provide Velocity loans with a reduced interest rate for customers who perform energy efficiency improvements (with approved credit). Program Spend 36,988 $ $ 200,000 Customers 7 Budget Includes cleared payments and pending payments. *Currently maintaining existing population of Cycle Saver water heater timers through replacement of units at 10 years. **Numbers based on M&V study summer of 2018. 2 of 3 8/10/2020 Data is unaudited and rounded to 2 decimal points. Program data is provided by individual Programs. Budget data source is eCOMBS. CES RMC SAVINGS REPORT FY20 Report As of 07/31/2020 Green Building Impacts Credited to Solar Energy Credited to Thermal Energy Storage Credited to Solar Energy Natural gas Building water Irrigation water Construction Waste diversion Outreach Program Austin Energy All-Stars ECAD Multifamily Compliance Saved 1.430 103551.00 16889.00 16590.00 20685.00 Units MW MW MWh CCF 1,000 gal 1,000 gal Tons UPDATE EES/GB Water Savings Gallons/yr. at 0.45 Gallon/kWh 50,552,192 Avoided power plant water consumption (evaporation only). NOTES Above expenditures may include encumbrances. SPUR savings numbers are now audited for the previous month. Therefore, they are reported with a one month delay. Money spent on the DR-Cycle Saver program is funded from the DR Power Partner (Residential) Rebate Budget. Total commercial participation does not include GB commercial square foot. Thermal Energy Storage Budget is not part of Customer Energy Solutions Budget. *Currently maintaining existing population of Cycle Saver water heater timers through replacement of units at 10 years. **Numbers based on M&V study summer of 2016. Free thermostats were not adjusted in FY18 for attrition. ++Budgets maintained within other programs and tracked outside of eCOMBS. Goals and savings are calculated to included T&D line losses and spinning reserves. The ERS MW total is based on contracted and ERCOT-tested capacity. ERS now only reports incremental MW increases. ǂ Budget for Residential Solar includes incentives only Energy code savings from building permits are reported in the corresponding month one year post permit, thus Energy code savings from FY2019 building permits are reported in FY2020. 3 of 3 8/10/2020 Data is unaudited and rounded to 2 decimal points. Program data is provided by individual Programs. Budget data source is eCOMBS.