Solar Monthly Report — original pdf
Backup
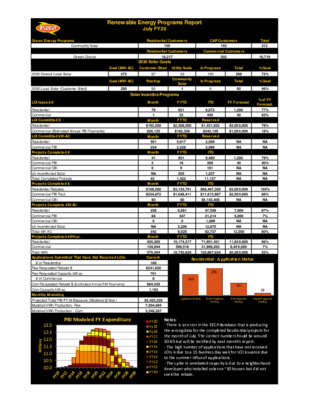
Total31218,719Goal (MW-AC)Customer-SitedUtility Scale In ProgressTotal% Goal2030 Overall Local Solar375873315026972%Goal (MW-AC)RooftopCommunity SolarIn ProgressTotal% Goal2030 Local Solar (Customer Sited)20083469346%MonthFYTDITDFY Forecast% of FY Forecast799219,6721,20077%1334364083%MonthFYTDReserved$192,500$2,368,500$1,431,852$3,000,00079%$26,135$182,328$242,139$1,000,00018%MonthFYTDReserved5015,9172,509NANA3342,2282,999NANAMonthFYTDITD419519,4801,20079%2163094040%00101NANANA3551,237NANA431,32211,127NANAMonthFYTDITD$108,500$3,133,761$66,467,328$3,000,000104%$234,872$1,649,411$11,613,987$2,500,00066%$0$0$6,143,408NANAMonthFYTDITD2596,08147,5497,00087%8434721,2145,0007%001,099NANANA3,20012,875NANA3429,62882,73712,00080%Projects Completed kWh/yr.MonthFYTDITD435,36010,174,31771,901,43111,830,00086%134,944569,51831,966,2038,450,0007%570,30410,743,835103,867,63420,280,00053%CurrentITD160$241,6207618NANANANA$84,329NANANANA1,183NANANANANANANANA$2,425,228NANANANA7,504,685NANANANA3,348,287NANANANACommercial PBIProjects Completed #Residential Com Capacity kW-acProjected Total PBI FY18 Exposure (Modeled $/Year)Applications Submitted That Have Not Received LOIsTotal kW ACResidential Commercial Total kWh # of Residential Residential Commercial PBIProjects Complete kW-ACCommercial CBIUn-Incentivized SolarModeled kWh Production- Res Modeled kWh Production - Com Monthly ModelingRes Requested Rebate $Res Requested Capacity kW-ac # of Commercial Com Requested Rebate $ (Estimated Annual PBI Payments)LOI Issued #Residential RebatesCommercial PBI Paid Commercial CBIProjects Completed $LOI Committed kW-ACLOI Committed $ Commercial CBIUn-Incentivized SolarTotal Completed ProjectsResidential Commercial ResidentialCommercial PBICommercial (Estimated Annual PBI Payments)ResidentialRenewable Energy Programs ReportJuly FY20CAP Customers159Residential CustomersSolar Incentive Programs18,217153Residential Customers502Commercial CustomersGreen Energy ProgramsCommunity SolarGreen Choice2030 Solar Goals1602069518Application PendingWork CompletionPendingFinal InspectionPendingPayment ApprovalPendingResidential -Application Status$0.0$0.5$1.0$1.5$2.0$2.5$3.0MillionsPBI Modeled FY ExpenditureFY20Fy19Fy18FY17FY16FY15FY14FY13FY12FY11FY10Notes:-Thereis an error in the EECP database that is producing the wrong data for the completed Residential projects for the month of July. The correct number should be around 50-60 but will be rectified by next month's report.-Thehigh number of applications that have not received LOIs is due to a 15 business day wait for LOI issuance due to the summer influx of applications.-The spike in unrebated capacity is due to a neighborhood developer who installed solar on ~50 houses but did not seek the rebate.