REGULAR MEETING OF THE RESOURCE MANAGEMENT COMMISSION November 17, 2026 6:00 p.m. Austin Energy Headquarters; 1st Floor; Shudde Fath Conference Room 4815 Mueller Blvd, Austin, Texas 78723 Some members of the Resource Management Commission maybe participating by video conference. Public comment will be allowed in-person or remotely by telephone. Speakers may only register to speak on an item once either in-person or remotely and will be allowed up to three minutes to provide their comments. Registration no later than noon the day before the meeting is required for remote participation. To register contact Natasha Goodwin, at Natasha.Goodwin@austinenergy.com or 512-322-6505. Members: Charlotte Davis, Chair (District 1) Paul Robbins, Vice Chair (District 5) John Abrams (Mayor) CALL MEETING TO ORDER AGENDA Kamil Cook (District 3) Trey Farmer (District 7) Yael Glazer (District 6) Harry Kennard (District 10) Martin Luecke (District 4) Raphael Schwartz (District 2) Alison Silverstein (District 9) PUBLIC COMMUNICATION: GENERAL The first 5 speakers signed up prior to the meeting being called to order will each be allowed a three-minute allotment to address their concerns regarding items not posted on the agenda. APPROVAL OF MINUTES 1. Approve the minutes of the Regular Called Resource Management Commission Meeting on October 20, 2026. STAFF BRIEFING 2. Staff briefing on highlights of Austin Water’s 2026 Q3 Report on Water Management Strategy Implementation by Kevin Kluge, Water Conservation Division Manager, Austin Water. DISCUSSION 3. Presentation by Texas Gas Service regarding a program update by Larry Graham, Manager, Local Government Relations, Texas Gas Service. 4. Discussion regarding the status of the District Energy and Cooling. DISCUSSION AND ACTION ITEMS 5. Discussion and recommendation that the Commission consider and/or make recommendations on any timely plans to invest in solar, wind, battery, geothermal and other alternate and/or renewable energy technologies. WORKING GROUP UPDATE 6. Update from the joint RMC/EUC Local Solar + Storage Process Working Group regarding meeting highlights and next steps. The City of Austin is committed to compliance with the Americans with Disabilities Act. Reasonable modifications and equal access to communications will be provided upon request. For assistance, please contact the Liaison or TTY users’ route through 711. A person may request language access accommodations no later than 48 hours before the scheduled meeting. Please call or email Natasha Goodwin at Austin Energy, at (512) 322-6505 or Natasha.Goodwin@austinenergy.com to request service or for additional information. For more information on the Resource Management Commission, please contact …
November 9, 2026 Water Management Strategy Implementation REPORT Third Quarter 2026, July - September November 9, 2026 1 2 Contents Third Quarter Summary Water Conservation Updates Water Loss Reduction Updates Reclaimed Water and Onsite Reuse Updates Conservation Outreach Updates Water Supply Project Updates Water Use and GPCD Notes Regarding Data 2 Austin Water Third Quarter 2026 Report 1 November 9, 2026 Third Quarter Introduction The Water Management Strategy Implementation Report is intended to provide transparency and accountability regarding the execution of strategies from the 2024 Water Conservation Plan and the 2024 Water Forward Plan. The plans include proactive and substantial demand management strategies and innovative local supply strategies, but the hard work necessary to complete the strategies and meet the goals are illustrated in the implementation reports. 2024 Water Loss Report recommendations response is complete – 32 of the 32 recommendations have been addressed. New Online Water Conservation Hub launched - Provides customers better information regarding applications, report submittals, and water waste enforcement. Expanded water conservation outreach – 28 million conservation-related media impressions and 327,000 Home Water Use Reports emailed with a 66% open rate. Water Conservation Updates Landscape Transformation Strategy 50% irrigation limit for new homes - Rule posted to Building Criteria Manual; applies to new home building permits after Oct. 1 New water conservation hub – improved application and communication for rebates, water waste enforcement, and commercial conservation Meter Hero Program – contracted program for AP Environmental Science students to utilize water use data in class projects Community Outreach Grants – Completed 1st year of grants; estimated 380 community members reached 3 4 3 4 Austin Water Third Quarter 2026 Report 2 Water Conservation Metrics Residential Rebate Programs Approved Rebates 40 35 30 25 20 15 10 5 0 Drought Survival Tools Irrigation Upgrades Rainwater Harvesting Rebates WaterWise Landscape WaterWise Rainscape Other Residential Programs Q3 2025-Q2 2026 Q3 2026 5 6 Water Conservation Metrics Commercial Rebate Programs Approved Rebates 5 4 3 2 1 0 4 3 2 2 1 Bucks for Business Q3 2025-Q2 2026 Q3 2026 November 9, 2026 5 6 Austin Water Third Quarter 2026 Report 3 November 9, 2026 Water Conservation Metrics Compliance Assessments Number of Compliant Commercial Facilities Number of Compliant Commercial Facilities 3500 3000 2500 2000 1500 1000 500 0 350 300 250 200 150 100 …
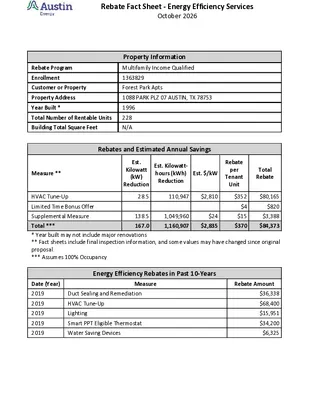
Rebate Fact Sheet - Energy Efficiency Services October 2026 Rebate Program Enrollment Property Information Multifamily Income Qualified 1363829 Customer or Property Forest Park Apts Property Address Year Built * Total Number of Rentable Units Building Total Square Feet 1088 PARK PLZ 07 AUSTIN, TX 78753 1996 228 N/A Measure ** Rebates and Estimated Annual Savings Est. Kilowatt (kW) Reduction Est. Kilowatt- hours (kWh) Reduction Est. $/kW Rebate per Tenant Unit Total Rebate HVAC Tune-Up Limited Time Bonus Offer Supplemental Measure 28.5 110,947 $2,810 $352 $80,165 138.5 1,049,960 $24 $4 $15 $820 $3,388 Total *** 167.0 * Year built may not include major renovations ** Fact sheets include final inspection information, and some values may have changed since original proposal. *** Assumes 100% Occupancy 1,160,907 $84,373 $2,835 $370 Energy Efficiency Rebates in Past 10-Years Date (Year) Measure Rebate Amount 2019 2019 2019 2019 2019 Duct Sealing and Remediation HVAC Tune-Up Lighting Smart PPT Eligible Thermostat Water Saving Devices $36,338 $68,400 $15,951 $34,200 $6,325 Energy Efficiency Services - Commercial and Multifamily Enrollment Pipeline 11/2/2026 Program WFS Location Name Installation Address Multifamily Income Qualified Installation Bridge at Midtown Commons 7200 EASY WIND DR C Council District 7 Multifamily Standard Rebates Installation The Standard at the Domain 11721 DOMAIN BLVD FW3 Multifamily Standard Rebates Installation The Olivine 3201 CENTURY PARK BLVD Multifamily Standard Rebates Installation Berkshire Santal Apartments 7624 TECOMA CIR 2 Multifamily Standard Rebates Post Inspection Falconhead 3400 S FM 620 RD 1 Multifamily Income Qualified Installation Multifamily Income Qualified Installation Park at Summers Grove Apartments Chesapeake Apartments 2900 CENTURY PARK BLVD UNIT 1 12300 HYMEADOW DR UNIT 1 Multifamily Income Qualified Installation Ashford Cameron Grove 8501 CAMERON RD 7 7 7 6 1 Measures Smart PPT Eligible Thermostat, HVAC Tune-Up Lighting, Smart PPT Eligible Thermostat, HVAC Tune-Up Plenum Redesign and Remediation, HVAC Tune- Up ECAD Incentive, Smart PPT Eligible Thermostat, HVAC Tune-Up Duct Sealing and Remediation, Smart PPT Eligible Thermostat, HVAC Tune-Up Smart PPT Eligible Thermostat, HVAC Tune-Up Attic Insulation, ECAD Incentive, Smart PPT Eligible Thermostat, HVAC Tune-Up Attic Insulation, Duct Sealing and Remediation, Lighting, Smart PPT Eligible Thermostat, Solar Screen/Solar Film, HVAC Tune-Up Est. kWh Savings 539,977 Est. $ Incentive $274,822 481,712 $266,299 595,106 $190,452 243,829 $143,524 885,441 $137,557 233,366 $133,996 122,898 $111,452 71,538 $84,623