3c. Urban Forest Stats - 2022 — original pdf
Backup

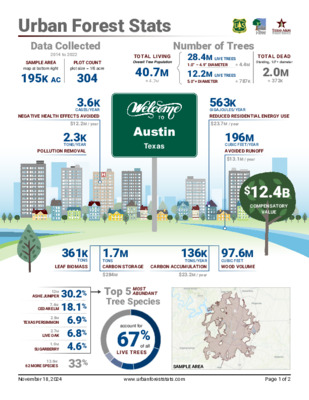
TOTAL LIVING Overall Tree Population 40.7M ± 4.7M Number of Trees 28.4M LIVE TREES 1.0” – 4.9” DIAMETER ± 4.4M 12.2M LIVE TREES 5.0”+ DIAMETER ± 787K TOTAL DEAD Standing, 1.0”+ diameter 2.0M ± 372K Urban Forest Stats Data Collected 2014 to 2022 SAMPLE AREA map at bottom right PLOT COUNT plot size = 1/6 acre 195K AC 304 CASES/YEAR NEGATIVE HEALTH EFFECTS AVOIDED 3.6K $12.2M / year 2.3K TONS/YEAR POLLUTION REMOVAL Austin Texas 563K $23.7M / year GIGAJOULES/YEAR REDUCED RESIDENTIAL ENERGY USE 196M CUBIC FEET/YEAR AVOIDED RUNOFF $13.1M / year $12.4B COMPENSATORY VALUE 361K TONS LEAF BIOMASS 1.7M TONS CARBON STORAGE TONS/YEAR CARBON ACCUMULATION $284M $23.2M / year 136K 97.6M CUBIC FEET WOOD VOLUME ASHE JUNIPER CEDAR ELM TEXAS PERSIMMON LIVE OAK SUGARBERRY 12M 30.2% 7.4M 18.1% 2.8M 6.9% 2.7M 6.8% 1.9M 4.6% 13.6M 33% 62 MORE SPECIES Top 5 MOST ABUNDANT Tree Species account for 67% of all LIVE TREES November 18, 2024 www.urbanforeststats.com Page 1 of 2 SAMPLE AREA Urban Forest Stats CONTINUED Austin’s Top 3 Tree Species LAND USE OWNERSHIP RESIDENTIAL OTHER DEVELOPED FOREST OTHER PUBLIC PRIVATE account for 14% of OTP account for 6% of OTP account for 80% of OTP account for <1% of OTP account for 55% of OTP account for 45% of OTP Cedar elm 775K Ashe juniper 630K Sugarberry 553K 5.75M TREES on 51.9K RESIDENTIAL AC Ashe juniper 410K Texas persimmon 287K Live oak 236K 2.46M TREES on 82.6K DEVELOPED AC Ashe juniper 11.2M Cedar elm 6.5M Texas persimmon 2.2M 32.4M TREES on 48.2K FOREST AC Ashe juniper 57K Honey mesquite 9.2K None — 66.5K TREES on 12.5K OTHER AC OVERALL TREE POPULATION DIAMETER (INCHES) Ashe juniper 6.3M Cedar elm 6.3M Texas persimmon 2.8M 28.4M Ashe juniper 4.2M Live oak 866K Cedar elm Ashe juniper 1.8M Live oak 687K Cedar elm Live oak 108K Ashe juniper 72K Pecan 743K 8.16M 348K 3.74M 19K 323K TREES with diameters 1.0” to 4.9” TREES with diameters 5.0” to 9.9” TREES with diameters 10.0” to 19.9” TREES with diameters 20.0” or greater Ashe juniper 7.3M Cedar elm 4.8M Chinese tallowtree 1.8M 22.3M TREES on 68.8K PUBLIC AC Ashe juniper 5.0M Cedar elm 2.5M Live oak 1.7M 18.3M TREES on 122.3K PRIVATE AC OVERALL TREE POPULATION MAINTAINED AREA Live oak 639K Sugarberry 603K Cedar elm 431K 4.59M TREES in areas MAINTAINED Ashe juniper 12.1M Cedar elm 6.9M Texas persimmon 2.6M 36.1M TREES in areas NOT MAINTAINED 1.0” TO 4.9” 5.0” TO 9.9” 10.0” TO 19.9” 20.0” OR GREATER MAINTAINED NOT MAINTAINED account for 70% of OTP account for 20% of OTP account for 9% of OTP account for <1% of OTP account for 11% of OTP account for 89% of OTP OVERALL TREE POPULATION OVERALL TREE POPULATION Building Impervious Permeable Herbaceous Water Ground Cover BY LAND USE RESIDENTIAL OTHER DEVELOPED FOREST OTHER 0% 25% 50% 75% 100% K = Thousand M = Million B = Billion AC = Acres OTP = Overall Tree Population Due to rounding, not all values will add up exactly NOTES: This report was created by Urban Forest Stats (www.urbanforeststats.com) using data from the USDA Forest Service Urban Forest Inventory and Analysis program (research.fs.usda.gov/programs/urbanfia). Urban FIA is the permanent establishment of plots and annualized inventory of trees in community settings to provide information on the status and trends of urban trees and forests over time. In addition to the plot data, UFIA administers the Urban National Landowner Survey (research.fs.usda.gov/programs/nwos) in some cities. Urban Forest Stats is available through a partnership between the USDA Forest Service and Texas A&M Forest Service. Many of the estimates rely on i-Tree methods and processing (www.itreetools.org). November 18, 2024 www.urbanforeststats.com Page 2 of 2