Wiley-Letter(1) — original pdf
Backup

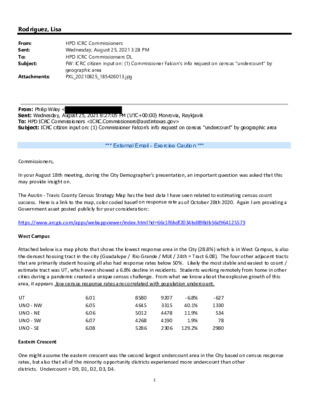
From: Sent: To: Subject: Attachments: HPD ICRC Commissioners Wednesday, August 25, 2021 3:28 PM HPD ICRC Commissionsers DL FW: ICRC citizen input on: (1) Commissioner Falcon's info request on census "undercount" by geographic area PXL_20210825_185426013.jpg Rodriguez, Lisa From: Philip Wiley < Sent: Wednesday, August 25, 2021 8:27:05 PM (UTC+00:00) Monrovia, Reykjavik To: HPD ICRC Commissioners <ICRC.Commissioners@austintexas.gov> Subject: ICRC citizen input on: (1) Commissioner Falcon's info request on census "undercount" by geographic area *** External Email - Exercise Caution *** Commissioners, In your August 18th meeting, during the City Demographer's presentation, an important question was asked that this may provide insight on. The Austin ‐ Travis County Census Strategy Map has the best data I have seen related to estimating census count success. Here is a link to the map, color coded based on response rate as of October 28th 2020. Again I am providing a Government asset posted publicly for your consideration:: https://www.arcgis.com/apps/webappviewer/index.html?id=66c1f6bdf2034bd898db56d964125573 West Campus Attached below is a map photo that shows the lowest response area in the City (28.8%) which is in West Campus, is also the densest housing tract in the city (Guadalupe / Rio Grande / MLK / 24th = Tract 6.08). The four other adjacent tracts that are primarily student housing all also had response rates below 50%. Likely the most stable and easiest to count / estimate tract was UT, which even showed a 6.8% decline in residents. Students working remotely from home in other cities during a pandemic created a unique census challenge. From what we know about the explosive growth of this area, it appears .low census response rates are correlated with population undercount. UT UNO ‐ NW UNO ‐ NE UNO ‐ SW UNO ‐ SE Eastern Crescent One might assume the eastern crescent was the second largest undercount area in the City based on census response rates, but also that all of the minority opportunity districts experienced more undercount than other districts. Undercount > D9, D1, D2, D3, D4. ‐6.8% 40.1% 11.9% 1.9% 129.2% 9207 3315 4478 4190 2306 8580 4645 5012 4268 5286 ‐627 1330 534 78 2980 6.01 6.05 6.06 6.07 6.08 1 Implications Likely ‐ some of the fastest growing parts / districts in the city also were the most undercounted. D10, which may be the slowest growing District in Austin, also had response rates >70%, >75%, >80%. Unless Districts are mapped at different sizes now, as appropriate to the extent allowed by law, then we will start out in the real world with very different size districts anyway, that widen significantly between now and the next census. This would seemingly dilute the minority voice that otherwise great effort is being taken to lift up. Thank you for your consideration, Philip Wiley Downtown resident (78701) D9 CAUTION: This email was received at the City of Austin, from an EXTERNAL source. Please use caution when clicking links or opening attachments. If you believe this to be a malicious and/or phishing email, please forward this email to cybersecurity@austintexas.gov. 2