20250806-002: RBI Austin Youth Development Complex Applicant Exhibits Part2 — original pdf
Backup
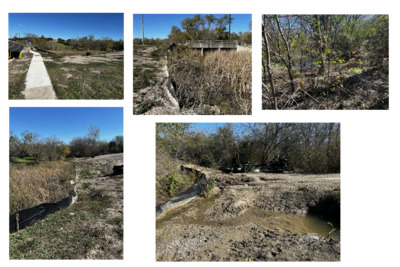
FUNCTIONAL ASSESSMENTOF FLOODPLAIN HEALTH 23 September 2021 Joe Farias Garza EMC 9442 Capital of Texas Highway North Austin, Texas 78759 RE: City of Austin Functional Assessment, Zone 2 — RBI at Loyola Lane Loyola Lane and Sendero Hills Parkway, Austin, Travis County, Texas HJN 21265.001 FA Dear Mr. Farias: The following provides a functional assessment of floodplain health findings from Horizon Environmental Services, Inc.’s (Horizon) field investigation conducted on 14 September 2021 for the above-referenced subject site. Horizon evaluated the subject site in accordance with the Watershed Protection Ordinance: Functional Assessment (FA) developed by the City of Austin (COA) Watershed Protection Development. The proposed project consists of development that has the potential to modify the 100-year floodplain and Critical Water Quality Zone (CWQZ) adjacent to unnamed tributaries of Walnut Creek. The subject site is located near the intersection of Loyola Lane and Sendero Hills Parkway, Austin, Travis County, Texas (Figure 1). Based on the location of the proposed construction activities within the CWQZ, Zone 2 of the FA was performed. Per the FA guidance, three 100-square-meter sample plots were to be evaluated along eight Zone 2 transects (Figure 2). Horizon took several photographs and measurements using the required tools listed in the FA. The tools included a 100-meter measuring tape, a densiometer, and a soil compaction meter. The hydric nature of vegetation species was determined from the US Army Corps of Engineers (USACE) National Wetland Plant List. Photographs from the FA are provided in Appendix A and scoring sheets for the eight transects are provided in Appendix B. 21265-001FA CORPORATE HEADQUARTERS 1507 S Interstate 35 Austin, TX 78741-2502 (512) 328-2430 www.horizon-esi.com An LJA Company Williamson Taylor, TX Lago Vista, TX §¨¦35 £¤183 Austin, TX Lee Manor, TX Elgin, TX Travis £¤290 Belterra, TX Hays §¨¦35 Subject Site £¤183 Elroy, TX Caldwell Bastrop Bastrop, TX " "" " " " " " " " " " """" Legend " " Transect Subject Site Date: Drawn: 09/15/2021 TED HJN NO: 21265.001FA Source: OSM, 2021 Figure 1 Vicinity Map RBI at Loyola Lane Loyola Lane and Sendero Hills Parkway Austin, Travis County, Texas I 0 1,000 2,000 Feet 21265 - RBI at Loyola Lane\Graphics\21265-001FA_01A_Vicinity.mxd " T-1 " T-7 " " " " T-6 " " " T-2 T-3 " " Parkway Hills Sendero Loyola Lane Cordoba Drive T-4 T-5 " " " " " T-8 Legend " " Transect Critical Water Quality Zone Subject Site Date: Drawn: 09/15/2021 TED HJN NO: 21265.001FA Source: COA, 2016; Nearmap, 2021 Figure 2 Functional Assessment RBI at Loyola Lane Loyola Lane and Sendero Hills Parkway Austin, Travis County, Texas 0 I 200 Feet 400 21265 - RBI at Loyola Lane\Graphics\21265-001FA_01A_Vicinity.mxd Joe Farias HJN 21265.001 FA 23 September 2021 Page 4 BASELINE CONDITIONS The floodplain and CWQZ within the subject site consisted of woodland and grassland vegetation. Vegetation included Ashe juniper (Juniperus ashei), sugarberry (Celtis laevigata), Chinese privet (Ligustrum sinense), cedar elm (Ulmus crassifolia), honey mesquite (Prosopis glandulosa), winged elm (Ulmus alata), black willow (Salix nigra), Texas persimmon (Diospyros texana), false willow (Baccharis neglecta), Texas prickly pear (Opuntia engelmannii), giant ragweed (Ambrosia trifida), silver bluestem (Bothriochloa saccharoides), tall goldenrod (Solidago altissima), spreading hedge-parsley (Torilis arvensis), common broomweed (Amphiachyris dracunculoides), marsh elder (Iva annua), purple morning glory (Ipomoea capillacea), greenbrier (Smilax bona- nox), and other upland forbs and grasses. SUMMARY The results of the Zone 2 - CWQZ FA indicated that the CWQZ within the subject site was in “Fair” condition with an average score of 16.5. Table 1 Zone 2 - Critical Water Quality Zone Transect Transect 1 (T-1) Transect 2 (T-2) Transect 3 (T-3) Transect 4 (T-4) Transect 5 (T-5) Transect 6 (T-6) Transect 7 (T-7) Transect 8 (T-8) Average Score 19 15 15 20 15 15 15 18 16.5 Please call if you have any questions or require additional information. Sincerely, For Horizon Environmental Services, Inc. Scott Flesher Vice President/Ecological Program Manager Tamura Dunbar Ecological Project Manager 21265-001FA Joe Farias HJN 21265.001 FA 23 September 2021 Page 5 REFERENCES (COA) City of Austin. “Austin Fully Developed Floodplain,” <https://data.austintexas.gov/ Environmental/Austin-Fully-Developed-Floodplain/2xn4-j3u2>. 25 June 2013; updated 24 August 2016. (Nearmap) Nearmap US, Inc. Nearmap VerticalTM digital orthographic photograph, <https://go.nearmap.com>. Imagery date 7 May 2021. <http://www.openstreetmap OpenStreetMap .org>. Available under the Open Database License (www.opendatacommons.org/ licenses/odbl). Accessed 15 September 2021. OpenStreetMap, contributors. (OSM) 21265-001FA APPENDIX A SITE PHOTOGRAPHS 21265-001FA PHOTO 1 View of Transect 1, Plot 1 PHOTO 2 View of Transect 1, Plot 1 PHOTO 3 View of Transect 1, Plot 2 PHOTO 4 View of Transect 1, Plot 2 App A - 21266-001FA Photographs PHOTO 5 View of Transect 1, Plot 3 PHOTO 6 View of Transect 1, Plot 3 PHOTO 7 View of Transect 2, Plot 1 PHOTO 8 View of Transect 2, Plot 1 App A - 21266-001FA Photographs PHOTO 9 View of Transect 2, Plot 2 PHOTO 10 View of Transect 2, Plot 2 PHOTO 11 View of Transect 2, Plot 3 PHOTO 12 View of Transect 2, Plot 3 App A - 21266-001FA Photographs PHOTO 13 View of Transect 3, Plot 1 PHOTO 14 View of Transect 3, Plot 1 PHOTO 15 View of Transect 3, Plot 2 PHOTO 16 View of Transect 3, Plot 2 App A - 21266-001FA Photographs PHOTO 17 View of Transect 3, Plot 3 PHOTO 18 View of Transect 3, Plot 3 PHOTO 19 View of Transect 4, Plot 1 PHOTO 20 View of Transect 4, Plot 1 App A - 21266-001FA Photographs PHOTO 21 View of Transect 4, Plot 2 PHOTO 22 View of Transect 4, Plot 2 PHOTO 23 View of Transect 4, Plot 3 PHOTO 24 View of Transect 4, Plot 3 App A - 21266-001FA Photographs PHOTO 25 View of Transect 5, Plot 1 PHOTO 26 View of Transect 5, Plot 1 PHOTO 27 View of Transect 5, Plot 2 PHOTO 28 View of Transect 5, Plot 2 App A - 21266-001FA Photographs PHOTO 29 View of Transect 6, Plot 1 PHOTO 30 View of Transect 6, Plot 1 PHOTO 31 View of Transect 6, Plot 2 PHOTO 32 View of Transect 6, Plot 2 App A - 21266-001FA Photographs PHOTO 33 View of Transect 6, Plot 3 PHOTO 34 View of Transect 6, Plot 3 PHOTO 35 View of Transect 7, Plot 1 PHOTO 36 View of Transect 7, Plot 1 App A - 21266-001FA Photographs PHOTO 37 View of Transect 7, Plot 2 PHOTO 38 View of Transect 7, Plot 2 PHOTO 39 View of Transect 7, Plot 3 PHOTO 40 View of Transect 7, Plot 3 App A - 21266-001FA Photographs PHOTO 41 View of Transect 8, Plot 1 PHOTO 42 View of Transect 8, Plot 1 PHOTO 43 View of Transect 8, Plot 2 PHOTO 44 View of Transect 8, Plot 2 App A - 21266-001FA Photographs APPENDIX B FUNCTIONAL ASSESSMENT SCORING SHEETS 21265-001FA Scoring: Zone 2 – Critical Water Quality Zone Site/Project Name: RBI at Loyola Lane Transect Number: Transect 1 Date: 09/14/2021 Time: 8:05 am Staff (if applicable): Tamura Dunbar Parameter Excellent (4) Good (3) Fair (2) Poor (1) Score Gap Frequency A visual assessment of the number of gaps in vegetation. 0 - 20% of riparian area has visual gaps in vegetation 20% - 40% of riparian area has visual gaps in vegetation 40 - 60% of riparian area has visual gaps in vegetation > 60% of riparian area has visual gaps in vegetation 7 or more pieces of large woody debris 5 - 6 pieces of large woody debris 3 - 4 pieces of large woody debris 2 or less pieces of large woody debris 0 - 125 pounds per square inch 126 - 175 pounds per square inch 176 - 225 pounds per square inch > 225 pounds per square inch Large Woody Debris An evaluation of the amount of large woody debris. Soil Compaction An assessment of the bulk density of the soil. Structural Diversity An evaluation of the canopy and understory vegetation. > 65% canopy; or > 50% canopy and > 50% understory 51 - 65% canopy; or 0 - 50% canopy and > 40% understory Tree Demography An assessment of the age class distribution of all canopy tree species. Canopy tree species are present in all 4 age classes Canopy tree species are present in 3 of 4 age classes 31 - 50% canopy; or 0 - 30% canopy and > 30% understory Canopy tree species are present in 2 of 4 age classes 0 - 30% canopy; or 0 - 15% canopy and 0 - 30% understory Canopy tree species are present in only 1 age class or no trees Wetland Tree Status Percent of total trees that are defined as FAC+ or greater with respect to wetland status. Riparian Zone Width A measure of the width of the undisturbed riparian zone. > 65% of trees are FAC+ or greater 50 - 65% of trees are FAC+ or greater 25 - 49% of trees are FAC+ or greater < 25% of trees are FAC+ or greater > 18 meters or > 75% of the CWQZ 12 - 18 meters or 50 - 75% of the CWQZ 6 - 12 meters or 25 - 49% of the CWQZ < 6 meters or < 25% of the CWQZ 3 4 3 2 2 1 4 Assessed Condition (Circle One) Excellent: 25 - 28 Good: 18 - 24 Fair: 11 - 17 Poor: 7 - 10 Zone 2 Score: 19 Field Sheet: Zone 2 – Critical Water Quality Zone Site/Project Name: RBI at Loyola Lane Transect Number: Transect 1 Gap Frequency Number of 1 meter gaps: 21 Percent of Transect: 21 % Soil Compaction Date: 09/14/2021 Time: 8:05 am Staff (if applicable): Tamura Dunbar Large Woody Debris Number of Large Woody Debris Pieces: 12 Plot 1 (5 meters) Plot 2 (50 meters) Plot 3 (95 meters) #1: 100 psi #2: 100 psi #3: 150 psi #1: 160 psi #2: 120 psi #3: 140 psi #1: 130 psi #2: 170 psi #3: 180 psi Average for Plot 1: 116.7 psi Average for Plot 2: 140 psi Average for Plot 3: 160 psi Structural Diversity Average for All Sample Plots: 138.9 psi Plot 1 (5 meters) Plot 2 (50 meters) Plot 3 (95 meters) Canopy: 40 % Understory: 10 % Canopy: 40 % Understory: 20 % Canopy: 25 % Understory: 5 % Tree Demography Average for All Sample Plots: Canopy: 35 % Understory: 11.7 % Plot 1 (5 meters) Plot 2 (50 meters) Plot 3 (95 meters) Number of Age Classes: 2 Number of Age Classes: 2 Number of Age Classes: 2 Average for All Sample Plots: 2 Field Sheet: Zone 2 – Critical Water Quality Zone Site/Project Name: RBI at Loyola Lane Transect Number: Transect 1 Wetland Tree Status Date: 09/14/2021 Time: 8:05 am Staff (if applicable): Tamura Dunbar Plot 1 (5 meters) Plot 2 (50 meters) Plot 3 (95 meters) Number of FAC+ or Greater Trees: 2 Number of FAC+ or Greater Trees: 0 Total Number of Trees: 17 Percent FAC+ or Greater: 12 % Total Number of Trees: 11 Percent FAC+ or Greater: 0 % Number of FAC+ or Greater Trees: 0 Total Number of Trees: 7 Percent FAC+ or Greater: 0 Riparian Zone Width Measurement 1 (5 meters) Measurement 2 (50 meters) Measurement 3 (95 meters) Riparian Zone Width: 29 m Riparian Zone Width: 27 m Riparian Zone Width: 21 m Average for All Sample Plots: 4 % % Average for All Measurements: 25.7 m Scoring: Zone 2 – Critical Water Quality Zone Site/Project Name: RBI at Loyola Lane Transect Number: Transect 2 Date: 09/14/2021 Time: 8:39 am Staff (if applicable): Tamura Dunbar Parameter Excellent (4) Good (3) Fair (2) Poor (1) Score Gap Frequency A visual assessment of the number of gaps in vegetation. 0 - 20% of riparian area has visual gaps in vegetation 20% - 40% of riparian area has visual gaps in vegetation 40 - 60% of riparian area has visual gaps in vegetation > 60% of riparian area has visual gaps in vegetation 7 or more pieces of large woody debris 5 - 6 pieces of large woody debris 3 - 4 pieces of large woody debris 2 or less pieces of large woody debris 0 - 125 pounds per square inch 126 - 175 pounds per square inch 176 - 225 pounds per square inch > 225 pounds per square inch Large Woody Debris An evaluation of the amount of large woody debris. Soil Compaction An assessment of the bulk density of the soil. Structural Diversity An evaluation of the canopy and understory vegetation. > 65% canopy; or > 50% canopy and > 50% understory 51 - 65% canopy; or 0 - 50% canopy and > 40% understory Tree Demography An assessment of the age class distribution of all canopy tree species. Canopy tree species are present in all 4 age classes Canopy tree species are present in 3 of 4 age classes 31 - 50% canopy; or 0 - 30% canopy and > 30% understory Canopy tree species are present in 2 of 4 age classes 0 - 30% canopy; or 0 - 15% canopy and 0 - 30% understory Canopy tree species are present in only 1 age class or no trees Wetland Tree Status Percent of total trees that are defined as FAC+ or greater with respect to wetland status. Riparian Zone Width A measure of the width of the undisturbed riparian zone. > 65% of trees are FAC+ or greater 50 - 65% of trees are FAC+ or greater 25 - 49% of trees are FAC+ or greater < 25% of trees are FAC+ or greater > 18 meters or > 75% of the CWQZ 12 - 18 meters or 50 - 75% of the CWQZ 6 - 12 meters or 25 - 49% of the CWQZ < 6 meters or < 25% of the CWQZ 4 1 2 1 2 1 4 Assessed Condition (Circle One) Excellent: 25 - 28 Good: 18 - 24 Fair: 11 - 17 Poor: 7 - 10 Zone 2 Score: 15 Field Sheet: Zone 2 – Critical Water Quality Zone Site/Project Name: RBI at Loyola Lane Transect Number: Transect 2 Gap Frequency Number of 1 meter gaps: 15 Percent of Transect: 15 % Soil Compaction Date: 09/14/2021 Time: 8:39 am Staff (if applicable): Tamura Dunbar Large Woody Debris Number of Large Woody Debris Pieces: 2 Plot 1 (5 meters) Plot 2 (50 meters) Plot 3 (95 meters) #1: 160 psi #2: 170 psi #3: 190 psi #1: 180 psi #2: 190 psi #3: 200 psi #1: 160 psi #2: 150 psi #3: 200 psi Average for Plot 1: 173.3 psi Average for Plot 2: 190 psi Average for Plot 3: 170 psi Structural Diversity Average for All Sample Plots: 177.8 psi Plot 1 (5 meters) Plot 2 (50 meters) Plot 3 (95 meters) Canopy: 15 % Understory: 10 % Canopy: 15 % Understory: 15 % Canopy: 30 % Understory: 5 % Tree Demography Average for All Sample Plots: Canopy: 20 % Understory: 10 % Plot 1 (5 meters) Plot 2 (50 meters) Plot 3 (95 meters) Number of Age Classes: 2 Number of Age Classes: 2 Number of Age Classes: 2 Average for All Sample Plots: 2 Field Sheet: Zone 2 – Critical Water Quality Zone Site/Project Name: RBI at Loyola Lane Transect Number: Transect 2 Wetland Tree Status Date: 09/14/2021 Time: 8:39 am Staff (if applicable): Tamura Dunbar Plot 1 (5 meters) Plot 2 (50 meters) Plot 3 (95 meters) Number of FAC+ or Greater Trees: 0 Total Number of Trees: 5 Percent FAC+ or Greater: 0 Number of FAC+ or Greater Trees: 0 Total Number of Trees: 5 Percent FAC+ or Greater: 0 % Number of FAC+ or Greater Trees: 0 Total Number of Trees: 7 Percent FAC+ or Greater: 0 % Riparian Zone Width Measurement 1 (5 meters) Measurement 2 (50 meters) Measurement 3 (95 meters) Riparian Zone Width: 15 m Riparian Zone Width: 24 m Riparian Zone Width: 21 m Average for All Sample Plots: 0 % % Average for All Measurements: 20 m Scoring: Zone 2 – Critical Water Quality Zone Site/Project Name: RBI at Loyola Lane Transect Number: Transect 3 Date: 09/14/2021 Time: 9:05 am Staff (if applicable): Tamura Dunbar Parameter Excellent (4) Good (3) Fair (2) Poor (1) Score Gap Frequency A visual assessment of the number of gaps in vegetation. 0 - 20% of riparian area has visual gaps in vegetation 20% - 40% of riparian area has visual gaps in vegetation 40 - 60% of riparian area has visual gaps in vegetation > 60% of riparian area has visual gaps in vegetation 7 or more pieces of large woody debris 5 - 6 pieces of large woody debris 3 - 4 pieces of large woody debris 2 or less pieces of large woody debris 0 - 125 pounds per square inch 126 - 175 pounds per square inch 176 - 225 pounds per square inch > 225 pounds per square inch Large Woody Debris An evaluation of the amount of large woody debris. Soil Compaction An assessment of the bulk density of the soil. Structural Diversity An evaluation of the canopy and understory vegetation. > 65% canopy; or > 50% canopy and > 50% understory 51 - 65% canopy; or 0 - 50% canopy and > 40% understory Tree Demography An assessment of the age class distribution of all canopy tree species. Canopy tree species are present in all 4 age classes Canopy tree species are present in 3 of 4 age classes 31 - 50% canopy; or 0 - 30% canopy and > 30% understory Canopy tree species are present in 2 of 4 age classes 0 - 30% canopy; or 0 - 15% canopy and 0 - 30% understory Canopy tree species are present in only 1 age class or no trees Wetland Tree Status Percent of total trees that are defined as FAC+ or greater with respect to wetland status. Riparian Zone Width A measure of the width of the undisturbed riparian zone. > 65% of trees are FAC+ or greater 50 - 65% of trees are FAC+ or greater 25 - 49% of trees are FAC+ or greater < 25% of trees are FAC+ or greater > 18 meters or > 75% of the CWQZ 12 - 18 meters or 50 - 75% of the CWQZ 6 - 12 meters or 25 - 49% of the CWQZ < 6 meters or < 25% of the CWQZ 3 3 2 1 2 1 3 Assessed Condition (Circle One) Excellent: 25 - 28 Good: 18 - 24 Fair: 11 - 17 Poor: 7 - 10 Zone 2 Score: 15 Field Sheet: Zone 2 – Critical Water Quality Zone Site/Project Name: RBI at Loyola Lane Transect Number: Transect 3 Gap Frequency Number of 1 meter gaps: 21 Percent of Transect: 21 % Soil Compaction Date: 09/14/2021 Time: 9:05 am Staff (if applicable): Tamura Dunbar Large Woody Debris Number of Large Woody Debris Pieces: 6 Plot 1 (5 meters) Plot 2 (50 meters) Plot 3 (95 meters) #1: 160 psi #2: 150 psi #3: 200 psi #1: 170 psi #2: 190 psi #3: 150 psi #1: 200 psi #2: 200 psi #3: 170 psi Average for Plot 1: 170 psi Average for Plot 2: 170 psi Average for Plot 3: 190 psi Structural Diversity Average for All Sample Plots: 176.7 psi Plot 1 (5 meters) Plot 2 (50 meters) Plot 3 (95 meters) Canopy: 30 % Understory: 5 % Canopy: 5 % Understory: 10 % Canopy: 40 % Understory: 0 % Tree Demography Average for All Sample Plots: Canopy: 25 % Understory: 5 % Plot 1 (5 meters) Plot 2 (50 meters) Plot 3 (95 meters) Number of Age Classes: 2 Number of Age Classes: 2 Number of Age Classes: 2 Average for All Sample Plots: 2 Field Sheet: Zone 2 – Critical Water Quality Zone Site/Project Name: RBI at Loyola Lane Transect Number: Transect 3 Wetland Tree Status Date: 09/14/2021 Time: 9:05 am Staff (if applicable): Tamura Dunbar Plot 1 (5 meters) Plot 2 (50 meters) Plot 3 (95 meters) Number of FAC+ or Greater Trees: 0 Total Number of Trees: 7 Percent FAC+ or Greater: 0 Number of FAC+ or Greater Trees: 0 Total Number of Trees: 3 Percent FAC+ or Greater: 0 % Number of FAC+ or Greater Trees: 0 Total Number of Trees: 7 Percent FAC+ or Greater: 0 % Riparian Zone Width Measurement 1 (5 meters) Measurement 2 (50 meters) Measurement 3 (95 meters) Riparian Zone Width: 16 m Riparian Zone Width: 0 m Riparian Zone Width: 27 m Average for All Sample Plots: 0 % % Average for All Measurements: 14.3 m Scoring: Zone 2 – Critical Water Quality Zone Site/Project Name: RBI at Loyola Lane Transect Number: Transect 4 Date: 09/14/2021 Time: 9:28 am Staff (if applicable): Tamura Dunbar Parameter Excellent (4) Good (3) Fair (2) Poor (1) Score Gap Frequency A visual assessment of the number of gaps in vegetation. 0 - 20% of riparian area has visual gaps in vegetation 20% - 40% of riparian area has visual gaps in vegetation 40 - 60% of riparian area has visual gaps in vegetation > 60% of riparian area has visual gaps in vegetation 7 or more pieces of large woody debris 5 - 6 pieces of large woody debris 3 - 4 pieces of large woody debris 2 or less pieces of large woody debris 0 - 125 pounds per square inch 126 - 175 pounds per square inch 176 - 225 pounds per square inch > 225 pounds per square inch Large Woody Debris An evaluation of the amount of large woody debris. Soil Compaction An assessment of the bulk density of the soil. Structural Diversity An evaluation of the canopy and understory vegetation. > 65% canopy; or > 50% canopy and > 50% understory 51 - 65% canopy; or 0 - 50% canopy and > 40% understory Tree Demography An assessment of the age class distribution of all canopy tree species. Canopy tree species are present in all 4 age classes Canopy tree species are present in 3 of 4 age classes 31 - 50% canopy; or 0 - 30% canopy and > 30% understory Canopy tree species are present in 2 of 4 age classes 0 - 30% canopy; or 0 - 15% canopy and 0 - 30% understory Canopy tree species are present in only 1 age class or no trees Wetland Tree Status Percent of total trees that are defined as FAC+ or greater with respect to wetland status. Riparian Zone Width A measure of the width of the undisturbed riparian zone. > 65% of trees are FAC+ or greater 50 - 65% of trees are FAC+ or greater 25 - 49% of trees are FAC+ or greater < 25% of trees are FAC+ or greater > 18 meters or > 75% of the CWQZ 12 - 18 meters or 50 - 75% of the CWQZ 6 - 12 meters or 25 - 49% of the CWQZ < 6 meters or < 25% of the CWQZ 3 4 3 3 2 1 4 Assessed Condition (Circle One) Excellent: 25 - 28 Good: 18 - 24 Fair: 11 - 17 Poor: 7 - 10 Zone 2 Score: 20 Field Sheet: Zone 2 – Critical Water Quality Zone Site/Project Name: RBI at Loyola Lane Transect Number: Transect 4 Gap Frequency Number of 1 meter gaps: 23 Percent of Transect: 23 % Soil Compaction Date: 09/14/2021 Time: 9:28 am Staff (if applicable): Tamura Dunbar Large Woody Debris Number of Large Woody Debris Pieces: 7 Plot 1 (5 meters) Plot 2 (50 meters) Plot 3 (95 meters) #1: 200 psi #2: 170 psi #3: 180 psi #1: 170 psi #2: 180 psi #3: 150 psi #1: 170 psi #2: 150 psi #3: 160 psi Average for Plot 1: 183.3 psi Average for Plot 2: 166.7 psi Average for Plot 3: 160 psi Structural Diversity Average for All Sample Plots: 170 psi Plot 1 (5 meters) Plot 2 (50 meters) Plot 3 (95 meters) Canopy: 60 % Understory: 5 % Canopy: 50 % Understory: 10 % Canopy: 70 % Understory: 20 % Tree Demography Average for All Sample Plots: Canopy: 60 % Understory: 11.7 % Plot 1 (5 meters) Plot 2 (50 meters) Plot 3 (95 meters) Number of Age Classes: 2 Number of Age Classes: 2 Number of Age Classes: 2 Average for All Sample Plots: 2 Field Sheet: Zone 2 – Critical Water Quality Zone Site/Project Name: RBI at Loyola Lane Transect Number: Transect 4 Wetland Tree Status Date: 09/14/2021 Time: 9:28 am Staff (if applicable): Tamura Dunbar Plot 1 (5 meters) Plot 2 (50 meters) Plot 3 (95 meters) Number of FAC+ or Greater Trees: 0 Total Number of Trees: 6 Percent FAC+ or Greater: 0 % Number of FAC+ or Greater Trees: 0 Number of FAC+ or Greater Trees: 4 Total Number of Trees: 10 Percent FAC+ or Greater: 0% Total Number of Trees: 16 Percent FAC+ or Greater: 25 Riparian Zone Width Measurement 1 (5 meters) Measurement 2 (50 meters) Measurement 3 (95 meters) Riparian Zone Width: 27 m Riparian Zone Width: 32 m Riparian Zone Width: 20 m Average for All Sample Plots: 8.3 % % Average for All Measurements: 26.3 m Scoring: Zone 2 – Critical Water Quality Zone Site/Project Name: RBI at Loyola Lane Date: 09/14/2021 Time: 10:24 am Transect Number: Transect 5 – 50 meters Staff (if applicable): Tamura Dunbar Parameter Excellent (4) Good (3) Fair (2) Poor (1) Score Gap Frequency A visual assessment of the number of gaps in vegetation. 0 - 20% of riparian area has visual gaps in vegetation 20% - 40% of riparian area has visual gaps in vegetation 40 - 60% of riparian area has visual gaps in vegetation > 60% of riparian area has visual gaps in vegetation 7 or more pieces of large woody debris 5 - 6 pieces of large woody debris 3 - 4 pieces of large woody debris 2 or less pieces of large woody debris 0 - 125 pounds per square inch 126 - 175 pounds per square inch 176 - 225 pounds per square inch > 225 pounds per square inch Large Woody Debris An evaluation of the amount of large woody debris. Soil Compaction An assessment of the bulk density of the soil. Structural Diversity An evaluation of the canopy and understory vegetation. > 65% canopy; or > 50% canopy and > 50% understory 51 - 65% canopy; or 0 - 50% canopy and > 40% understory Tree Demography An assessment of the age class distribution of all canopy tree species. Canopy tree species are present in all 4 age classes Canopy tree species are present in 3 of 4 age classes 31 - 50% canopy; or 0 - 30% canopy and > 30% understory Canopy tree species are present in 2 of 4 age classes 0 - 30% canopy; or 0 - 15% canopy and 0 - 30% understory Canopy tree species are present in only 1 age class or no trees Wetland Tree Status Percent of total trees that are defined as FAC+ or greater with respect to wetland status. Riparian Zone Width A measure of the width of the undisturbed riparian zone. > 65% of trees are FAC+ or greater 50 - 65% of trees are FAC+ or greater 25 - 49% of trees are FAC+ or greater < 25% of trees are FAC+ or greater > 18 meters or > 75% of the CWQZ 12 - 18 meters or 50 - 75% of the CWQZ 6 - 12 meters or 25 - 49% of the CWQZ < 6 meters or < 25% of the CWQZ 2 4 2 2 2 1 2 Assessed Condition (Circle One) Excellent: 25 - 28 Good: 18 - 24 Fair: 11 - 17 Poor: 7 - 10 Zone 2 Score: 15 Field Sheet: Zone 2 – Critical Water Quality Zone Site/Project Name: RBI at Loyola Lane Date: 09/14/2021 Time: 10:24 am Transect Number: Transect 5 – 50 meters Staff (if applicable): Tamura Dunbar Gap Frequency Number of 1 meter gaps: 21 Percent of Transect: 42 % Soil Compaction Large Woody Debris Number of Large Woody Debris Pieces: 7 Plot 1 (5 meters) Plot 2 (50 meters) Plot 3 (95 meters) #1: 200 psi #2: 150 psi #3: 200 psi #1: 150 psi #2: 200 psi #3: 200 psi #1: psi #2: psi #3: psi Average for Plot 1: 183.3 psi Average for Plot 2: 183.3 psi Average for Plot 3: psi Structural Diversity Average for All Sample Plots: 183.3 psi Plot 1 (5 meters) Plot 2 (50 meters) Plot 3 (95 meters) Canopy: 60 % Understory: 5 % Canopy: 20 % Understory: 0 % Canopy: % Understory: % Tree Demography Average for All Sample Plots: Canopy: 40 % Understory: 2.5 % Plot 1 (5 meters) Plot 2 (50 meters) Plot 3 (95 meters) Number of Age Classes: 2 Number of Age Classes: 1 Number of Age Classes: Average for All Sample Plots: 1.5 Field Sheet: Zone 2 – Critical Water Quality Zone Site/Project Name: RBI at Loyola Lane Date: 09/14/2021 Time: 10:24 am Transect Number: Transect 5 – 50 meters Staff (if applicable): Tamura Dunbar Wetland Tree Status Plot 1 (5 meters) Plot 2 (50 meters) Plot 3 (95 meters) Number of FAC+ or Greater Trees: 2 Total Number of Trees: 11 Percent FAC+ or Greater: 18.2 % Number of FAC+ or Greater Trees: 0 Total Number of Trees: 8 Percent FAC+ or Greater: 0 Number of FAC+ or Greater Trees: Total Number of Trees: Percent FAC+ or Greater: % Riparian Zone Width Measurement 1 (5 meters) Measurement 2 (50 meters) Measurement 3 (95 meters) Riparian Zone Width: 19 m Riparian Zone Width: 3 m Riparian Zone Width: m Average for All Sample Plots: 9.1 % % Average for All Measurements: 11 m Scoring: Zone 2 – Critical Water Quality Zone Site/Project Name: RBI at Loyola Lane Transect Number: Transect 6 Date: 09/14/2021 Time: 11:25 am Staff (if applicable): Tamura Dunbar Parameter Excellent (4) Good (3) Fair (2) Poor (1) Score Gap Frequency A visual assessment of the number of gaps in vegetation. 0 - 20% of riparian area has visual gaps in vegetation 20% - 40% of riparian area has visual gaps in vegetation 40 - 60% of riparian area has visual gaps in vegetation > 60% of riparian area has visual gaps in vegetation 7 or more pieces of large woody debris 5 - 6 pieces of large woody debris 3 - 4 pieces of large woody debris 2 or less pieces of large woody debris 0 - 125 pounds per square inch 126 - 175 pounds per square inch 176 - 225 pounds per square inch > 225 pounds per square inch Large Woody Debris An evaluation of the amount of large woody debris. Soil Compaction An assessment of the bulk density of the soil. Structural Diversity An evaluation of the canopy and understory vegetation. > 65% canopy; or > 50% canopy and > 50% understory 51 - 65% canopy; or 0 - 50% canopy and > 40% understory Tree Demography An assessment of the age class distribution of all canopy tree species. Canopy tree species are present in all 4 age classes Canopy tree species are present in 3 of 4 age classes 31 - 50% canopy; or 0 - 30% canopy and > 30% understory Canopy tree species are present in 2 of 4 age classes 0 - 30% canopy; or 0 - 15% canopy and 0 - 30% understory Canopy tree species are present in only 1 age class or no trees Wetland Tree Status Percent of total trees that are defined as FAC+ or greater with respect to wetland status. Riparian Zone Width A measure of the width of the undisturbed riparian zone. > 65% of trees are FAC+ or greater 50 - 65% of trees are FAC+ or greater 25 - 49% of trees are FAC+ or greater < 25% of trees are FAC+ or greater > 18 meters or > 75% of the CWQZ 12 - 18 meters or 50 - 75% of the CWQZ 6 - 12 meters or 25 - 49% of the CWQZ < 6 meters or < 25% of the CWQZ 3 1 3 1 2 1 4 Assessed Condition (Circle One) Excellent: 25 - 28 Good: 18 - 24 Fair: 11 - 17 Poor: 7 - 10 Zone 2 Score: 15 Field Sheet: Zone 2 – Critical Water Quality Zone Site/Project Name: RBI at Loyola Lane Date: 09/14/2021 Time: 11:25 am Transect Number: Transect 6 Gap Frequency Number of 1 meter gaps: 26 Percent of Transect: 26 % Soil Compaction Staff (if applicable): Tamura Dunbar Large Woody Debris Number of Large Woody Debris Pieces: 0 Plot 1 (5 meters) Plot 2 (50 meters) Plot 3 (95 meters) #1: 140 psi #2: 150 psi #3: 160 psi #1: 140 psi #2: 160 psi #3: 170 psi #1: 150 psi #2: 140 psi #3: 170 psi Average for Plot 1: 150 psi Average for Plot 2: 156.7 psi Average for Plot 3: 153.3 psi Structural Diversity Average for All Sample Plots: 153.3 psi Plot 1 (5 meters) Plot 2 (50 meters) Plot 3 (95 meters) Canopy: 30 % Understory: 5 % Canopy: 30 % Understory: 15 % Canopy: 20 % Understory: 15 % Tree Demography Average for All Sample Plots: Canopy: 26.7 % Understory: 11.7 % Plot 1 (5 meters) Plot 2 (50 meters) Plot 3 (95 meters) Number of Age Classes: 2 Number of Age Classes: 2 Number of Age Classes: 2 Average for All Sample Plots: 2 Field Sheet: Zone 2 – Critical Water Quality Zone Site/Project Name: RBI at Loyola Lane Transect Number: Transect 6 Wetland Tree Status Date: 09/14/2021 Time: 11:25 am Staff (if applicable): Tamura Dunbar Plot 1 (5 meters) Plot 2 (50 meters) Plot 3 (95 meters) Number of FAC+ or Greater Trees: 0 Number of FAC+ or Greater Trees: 0 Number of FAC+ or Greater Trees: 0 Total Number of Trees: 11 Percent FAC+ or Greater: 0 % Total Number of Trees: 15 Percent FAC+ or Greater: 0 % Total Number of Trees: 12 Percent FAC+ or Greater: 0 Riparian Zone Width Measurement 1 (5 meters) Measurement 2 (50 meters) Measurement 3 (95 meters) Riparian Zone Width: 11 m Riparian Zone Width: 15 m Riparian Zone Width: 29 m Average for All Sample Plots: 0 % % Average for All Measurements: 18.3 m Scoring: Zone 2 – Critical Water Quality Zone Site/Project Name: RBI at Loyola Lane Transect Number: Transect 7 Date: 09/14/2021 Time: 12:00 pm Staff (if applicable): Tamura Dunbar Parameter Excellent (4) Good (3) Fair (2) Poor (1) Score Gap Frequency A visual assessment of the number of gaps in vegetation. 0 - 20% of riparian area has visual gaps in vegetation 20% - 40% of riparian area has visual gaps in vegetation 40 - 60% of riparian area has visual gaps in vegetation > 60% of riparian area has visual gaps in vegetation 7 or more pieces of large woody debris 5 - 6 pieces of large woody debris 3 - 4 pieces of large woody debris 2 or less pieces of large woody debris 0 - 125 pounds per square inch 126 - 175 pounds per square inch 176 - 225 pounds per square inch > 225 pounds per square inch Large Woody Debris An evaluation of the amount of large woody debris. Soil Compaction An assessment of the bulk density of the soil. Structural Diversity An evaluation of the canopy and understory vegetation. > 65% canopy; or > 50% canopy and > 50% understory 51 - 65% canopy; or 0 - 50% canopy and > 40% understory Tree Demography An assessment of the age class distribution of all canopy tree species. Canopy tree species are present in all 4 age classes Canopy tree species are present in 3 of 4 age classes 31 - 50% canopy; or 0 - 30% canopy and > 30% understory Canopy tree species are present in 2 of 4 age classes 0 - 30% canopy; or 0 - 15% canopy and 0 - 30% understory Canopy tree species are present in only 1 age class or no trees Wetland Tree Status Percent of total trees that are defined as FAC+ or greater with respect to wetland status. Riparian Zone Width A measure of the width of the undisturbed riparian zone. > 65% of trees are FAC+ or greater 50 - 65% of trees are FAC+ or greater 25 - 49% of trees are FAC+ or greater < 25% of trees are FAC+ or greater > 18 meters or > 75% of the CWQZ 12 - 18 meters or 50 - 75% of the CWQZ 6 - 12 meters or 25 - 49% of the CWQZ < 6 meters or < 25% of the CWQZ 2 1 3 1 3 1 4 Assessed Condition (Circle One) Excellent: 25 - 28 Good: 18 - 24 Fair: 11 - 17 Poor: 7 - 10 Zone 2 Score: 15 Field Sheet: Zone 2 – Critical Water Quality Zone Site/Project Name: RBI at Loyola Lane Transect Number: Transect 7 Gap Frequency Number of 1 meter gaps: 60 Percent of Transect: 60 % Soil Compaction Date: 09/14/2021 Time: 12:00 pm Staff (if applicable): Tamura Dunbar Large Woody Debris Number of Large Woody Debris Pieces: 0 Plot 1 (5 meters) Plot 2 (50 meters) Plot 3 (95 meters) #1: 170 psi #2: 170 psi #3: 150 psi #1: 160 psi #2: 150 psi #3: 170 psi #1: 160 psi #2: 150 psi #3: 190 psi Average for Plot 1: 163.3 psi Average for Plot 2: 160 psi Average for Plot 3: 166.7 psi Structural Diversity Average for All Sample Plots: 163.3 psi Plot 1 (5 meters) Plot 2 (50 meters) Plot 3 (95 meters) Canopy: 15 % Understory: 5 % Canopy: 40 % Understory: 10 % Canopy: 0 % Understory: 0 % Tree Demography Average for All Sample Plots: Canopy: 18.3 % Understory: 5 % Plot 1 (5 meters) Plot 2 (50 meters) Plot 3 (95 meters) Number of Age Classes: 2 Number of Age Classes: 3 Number of Age Classes: 0 Average for All Sample Plots: 1.7 Field Sheet: Zone 2 – Critical Water Quality Zone Site/Project Name: RBI at Loyola Lane Transect Number: Transect 7 Wetland Tree Status Date: 09/14/2021 Time: 12:00 pm Staff (if applicable): Tamura Dunbar Plot 1 (5 meters) Plot 2 (50 meters) Plot 3 (95 meters) Number of FAC+ or Greater Trees: 1 Total Number of Trees: 6 Percent FAC+ or Greater: 16.7 % Number of FAC+ or Greater Trees: 0 Total Number of Trees: 28 Percent FAC+ or Greater: 0 % Number of FAC+ or Greater Trees: 0 Total Number of Trees: 0 Percent FAC+ or Greater: 0 Riparian Zone Width Measurement 1 (5 meters) Measurement 2 (50 meters) Measurement 3 (95 meters) Riparian Zone Width: 29 m Riparian Zone Width: 27 m Riparian Zone Width: 0 m Average for All Sample Plots: 5.6 % % Average for All Measurements: 18.7 m Scoring: Zone 2 – Critical Water Quality Zone Site/Project Name: RBI at Loyola Lane Date: 09/14/2021 Time: 10:54 am Transect Number: Transect 8 – 50 meters Staff (if applicable): Tamura Dunbar Parameter Excellent (4) Good (3) Fair (2) Poor (1) Score Gap Frequency A visual assessment of the number of gaps in vegetation. 0 - 20% of riparian area has visual gaps in vegetation 20% - 40% of riparian area has visual gaps in vegetation 40 - 60% of riparian area has visual gaps in vegetation > 60% of riparian area has visual gaps in vegetation 7 or more pieces of large woody debris 5 - 6 pieces of large woody debris 3 - 4 pieces of large woody debris 2 or less pieces of large woody debris 0 - 125 pounds per square inch 126 - 175 pounds per square inch 176 - 225 pounds per square inch > 225 pounds per square inch Large Woody Debris An evaluation of the amount of large woody debris. Soil Compaction An assessment of the bulk density of the soil. Structural Diversity An evaluation of the canopy and understory vegetation. > 65% canopy; or > 50% canopy and > 50% understory 51 - 65% canopy; or 0 - 50% canopy and > 40% understory Tree Demography An assessment of the age class distribution of all canopy tree species. Canopy tree species are present in all 4 age classes Canopy tree species are present in 3 of 4 age classes 31 - 50% canopy; or 0 - 30% canopy and > 30% understory Canopy tree species are present in 2 of 4 age classes 0 - 30% canopy; or 0 - 15% canopy and 0 - 30% understory Canopy tree species are present in only 1 age class or no trees Wetland Tree Status Percent of total trees that are defined as FAC+ or greater with respect to wetland status. Riparian Zone Width A measure of the width of the undisturbed riparian zone. > 65% of trees are FAC+ or greater 50 - 65% of trees are FAC+ or greater 25 - 49% of trees are FAC+ or greater < 25% of trees are FAC+ or greater > 18 meters or > 75% of the CWQZ 12 - 18 meters or 50 - 75% of the CWQZ 6 - 12 meters or 25 - 49% of the CWQZ < 6 meters or < 25% of the CWQZ 2 4 3 2 3 1 3 Assessed Condition (Circle One) Excellent: 25 - 28 Good: 18 - 24 Fair: 11 - 17 Poor: 7 - 10 Zone 2 Score: 18 Field Sheet: Zone 2 – Critical Water Quality Zone Site/Project Name: RBI at Loyola Lane Date: 09/14/2021 Time: 10:54 am Transect Number: Transect 8 – 50 meters Staff (if applicable): Tamura Dunbar Gap Frequency Number of 1 meter gaps: 23 Percent of Transect: 46 % Soil Compaction Large Woody Debris Number of Large Woody Debris Pieces: 14 Plot 1 (5 meters) Plot 2 (50 meters) Plot 3 (95 meters) #1: 160 psi #2: 150 psi #3: 140 psi #1: 140 psi #2: 140 psi #3: 150 psi #1: psi #2: psi #3: psi Average for Plot 1: 150 psi Average for Plot 2: 143.3 psi Average for Plot 3: psi Structural Diversity Average for All Sample Plots: 146.7 psi Plot 1 (5 meters) Plot 2 (50 meters) Plot 3 (95 meters) Canopy: 50 % Understory: 10 % Canopy: 15 % Understory: 15 % Canopy: % Understory: % Tree Demography Average for All Sample Plots: Canopy: 32.5 % Understory: 12.5 % Plot 1 (5 meters) Plot 2 (50 meters) Plot 3 (95 meters) Number of Age Classes: 3 Number of Age Classes: 2 Number of Age Classes: Average for All Sample Plots: 2.5 Field Sheet: Zone 2 – Critical Water Quality Zone Site/Project Name: RBI at Loyola Lane Date: 09/14/2021 Time: 10:54 am Transect Number: Transect 8 – 50 meters Staff (if applicable): Tamura Dunbar Wetland Tree Status Plot 1 (5 meters) Plot 2 (50 meters) Plot 3 (95 meters) Number of FAC+ or Greater Trees: 0 Total Number of Trees: 4 Percent FAC+ or Greater: 0 Number of FAC+ or Greater Trees: 0 Total Number of Trees: 1 Percent FAC+ or Greater: 0 % Number of FAC+ or Greater Trees: Total Number of Trees: Percent FAC+ or Greater: % Riparian Zone Width Measurement 1 (5 meters) Measurement 2 (50 meters) Measurement 3 (95 meters) Riparian Zone Width: 27 m Riparian Zone Width: 4 m Riparian Zone Width: m Average for All Sample Plots: 0 % % Average for All Measurements: 15.5 m