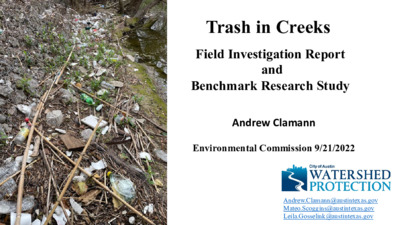
20220921-004: Trash in Creeks Presentation — original pdf
Backup

Trash in Creeks Field Investigation Report and Benchmark Research Study Andrew Clamann Environmental Commission 9/21/2022 Andrew.Clamann@austintexas.gov Mateo.Scoggins@austintexas.gov Leila.Gosselink@austintexas.gov Resolution No. 20200123-108 (CIUR 2234) field study benchmark report upstream concentration source downstream concentration Typical pollutant assessment: downstream – upstream = source contribution This assessment does not work for trash Variability in storm intensity Variability in stream character Data Collection • 20 Creeks • 110 miles • Observations every 30ft • 19,467 data points Scooters only 21 found Small number of occurrence due to: o reduced permitted fleets (since 2020) o improved process for reporting (311) o efficient process for removal (vendor) Trash intensity score + source presence • Overflowing dumpster • Outfall/tributary • Encampment • Dumping historic site • Dumping point source • Dumping unknown • Property management Sources by occurrence Takeaway # 1 Encampment was the most commonly-observed source, but is similar in intensity and range to most other sources Result: A georeferenced map of intensity* and sources example: upper shoal creek *can be used by internal or external partners for strategic cleaning https://arcg.is/0z48bj0 Takeaway # 2 Trash intensity is not proportional to its drainage area (source input locations are deceiving) Geospatial analysis using 300’ and 3000’ buffers Population Transportation Land Use Takeaway # 3 There were no statistically significant correlations between trash intensity and: landuse, census, transportation, • • • • parks, etc. Takeaway # 4 Virtually anything can be found in creeks, but single use plastics were the most common item clothing, tents, bedding recreation items, toys erosion matting, silt fences packaging, shipping office, household lawn tools, mulch bags, garden hoses, appliances medical, electronics, textiles, hardware traffic cones, barriers, safety construction materials, asphalt, lumber Telecommunication cables, displaced infrastructure 500+ shopping carts Takeaway # 5 76% of the trash is found in 10% of the area (opportunity for strategic site selection for cleanups by COA, partners, contractors, volunteers) Field report provides diverse assemblage of recommendations at different scales • • • • • • • site-specific cleanups, improved rules for dumpsters, structural controls, enforcement, education/outreach, coordination with partners, etc Benchmarking Research Report • EXTRACTION (physically removing trash from waterways) ex: structural controls, machines, manual labor • INTERCEPTION (keeping trash from entering waterways) ex: education, enforcement, landscape cleanups, structural controls • SOURCE REDUCTION (stemming the flow into our community) ex: limit single use plastics Extraction • creek and lake cleanups* • requirement/enforcement of vendors/individuals to clean up • targeted cleanups at "hot spots" • novel devices to concentrate trash and/or ease retrieval (e.g. booms, trash traps, etc) *Partners, contractors, COA staff, ARR “Clean Creeks Crew” staffed and operational this year, Examples of highly visible incentivized community participation Free kayaks for cleanup commitment - Urban Rivers Chicago, River Rangers Tourist "Trash Fishing" -Netherlands (photo) -Individual boats Troy, MI Interception • Enforcement and facilitated reporting ex: Philadelphia's "Sweep Program" including citations and fines • Ordinances to reduce incidence and effects of overflowing dumpsters • Shopping cart on-site retention • Telecommunications cable removal Interception Capacity, proximity, accessibility • Solar compacting bins • Mesh bags on water (Buffalo River) • Litter Boat • Increase waste receptacles at picnic tables • Free Dump Days • Continue/increase services at encampments Evaluate street sweeping Evaluate drainage system controls Curb inlet guards with street sweeping or Adopt-A-Drain • • WQ/Detention ponds retention/removal of floatables Source Reduction Education and outreach Solicit voluntary partnership/cooperation with businesses • example: HEB leadership during/after the bag ban Water stations to reduce dependance on bottles Restriction/requirements New Braunfels Can Ban • glass/Styrofoam restriction/requirements in city-owned properties • education/check-point at entry and launch points providing mesh bags and limiting Styrofoam coolers & glass (example: San Marcos) Campaigns or strategies to reduce use of single-use plastics and Styrofoam • Regulations/bans (novel strategies) • Political considerations Collaboration for a citywide, integrated trash management effort Bottom Line Trash in creeks is a result of the entire community; there is no “one source” primarily to blame COA and Partners are actively engaged in the solution; there is room for improvement and innovation Next Steps COA is working to improve efficiency and effectiveness of programs to extract, intercept, and reduce trash The results and recommendations from reports can inform site selection and strategies to address trash in creeks Appreciation Partners Austin Resource Recovery PARD WPD Field Operations Keep Austin Beautiful The Other Ones Foundation Austin Parks Foundation Contractors and Volunteers Benchmark research Leila Gosselink • Jeremy Walker-Lee Design, fieldwork and report • Mateo Scoggins • • Ryan Burke Lauren Parrish • Todd Jackson • • Brent Bellinger Data management and analysis • Rob Clayton James Collins • • William Burdick • Abel Porras Ed Peacock • Questions?