20200213-002b: Quarterly Arborist Report FY19 — original pdf
Backup
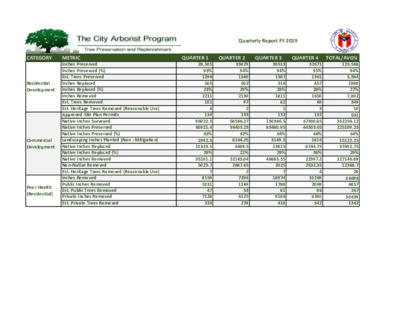
CATEGORY Residential Development Commercial Development Poor Health (Residential) METRIC Inches Preserved Inches Preserved (%) Est. Trees Preserved Inches Replaced Inches Replaced (%) Inches Removed Est. Trees Removed Est. Heritage Trees Removed (Reasonable Use) Approved Site Plan Permits Native Inches Surveyed Native Inches Preserved Native Inches Preserved (%) Landscaping Inches Planted (Non - Mitigation) Native Inches Replaced Native Inches Replaced (%) Native Inches Removed Non-Native Removed Est. Heritage Trees Removed (Reasonable Use) Inches Removed Public Inches Removed Est. Public Trees Removed Private Inches Removed Est. Private Trees Removed Quarterly Report FY 2019 QUARTER 1 QUARTER 2 QUARTER 3 QUARTER 4 28,505 93% 1296 505 23% 2211 101 4 134 96022.5 60921.4 63% 1992.5 10323.5 29% 35101.1 5023.7 7 8159 1031 47 7128 324 33879 94% 1540 502 29% 2130 97 2 133 58566.27 36403.23 62% 8164.25 4609.5 21% 22163.04 2687.65 2 7294 1169 53 6125 278 30513 94% 1387 516 28% 1811 82 1 132 130366.5 83480.95 64% 3149.5 13815 29% 46885.55 2025 7 10974 1788 81 9186 418 32671 95% 1361 457 28% 1650 69 3 132 67300.85 44303.65 66% 1816 8744.75 38% 22997.2 2632.35 4 10269 2069 86 8200 342 TOTAL/AVG% 125,568 94% 5,584 1980 27% 7,802 349 10 531 352256.12 225109.23 64% 15122.25 37492.75 29% 127146.89 12368.7 20 36696 6057 267 30639 1362