Data Services & Overview — original pdf
Backup
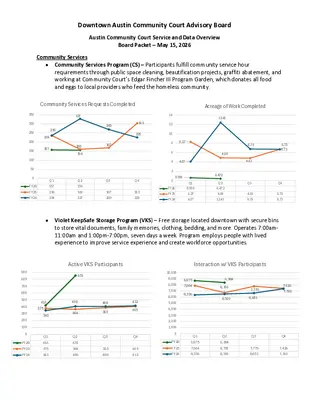
Downtown Austin Community Court Advisory Board Austin Community Court Service and Data Overview Board Packet – May 15, 2026 Community Services • Community Services Program (CS) – Participants fulfill community service hour requirements through public space cleaning, beautification projects, graffiti abatement, and working at Community Court’s Edgar Fincher III Program Garden, which donates all food and eggs to local providers who feed the homeless community. Community Services Requests Completed Acreage of Work Completed 350 300 250 200 150 100 50 0 FY26 FY25 FY24 236 234 157 Q1 157 236 234 327 160 154 Q2 154 160 327 269 167 Q3 167 269 303 225 Q4 303 225 14 12 10 8 6 4 2 0 FY26 FY25 FY24 8.27 4.07 0.599 Q1 0.599 8.27 4.07 12.41 4.89 0.472 Q2 0.472 4.89 12.41 6.78 4.83 Q3 4.83 6.78 6.73 6.73 Q4 6.73 6.73 • Violet KeepSafe Storage Program (VKS) – Free storage located downtown with secure bins to store vital documents, family memories, clothing, bedding, and more. Operates 7:00am- 11:00am and 1:00pm-7:00pm, seven days a week. Program employs people with lived experience to improve service experience and create workforce opportunities. Active VKS Participants Interaction w/ VKS Participants 900 800 700 600 500 400 300 200 100 0 FY26 FY25 FY24 418 375 343 Q1 418 375 343 851 406 364 Q2 851 364 406 406 385 Q3 385 406 412 405 Q4 405 412 10,000 9,000 8,000 7,000 6,000 5,000 4,000 3,000 2,000 1,000 0 FY26 FY25 FY24 8,675 7,864 6,338 8,364 6,700 6,500 Q1 8,675 7,864 6,338 Q2 8,364 6,700 6,500 7,779 6,651 Q3 7,779 6,651 7,428 7,381 Q4 7,428 7,381 Court Services • Restorative justice and problem-solving court – Fine-only court with emphasis on alternative resolutions, and provides an immediate connection to onsite case managers, basic needs, and social service resources. Community Court resolves Class C criminal offenses in catchment area, and Proposition B and State camping ban cases citywide. 1,200 1,000 800 600 400 200 0 FY26 FY25 FY24 969 764 408 Q1 969 764 408 Number of Cases Filed 982 833 Q3 833 982 743 708 728 Q2 708 728 743 1079 961 Q4 1079 961 Number of Cases Docketed 3,218 3,240 2,008 927 Q1 3,218 2,008 927 1,699 1,657 Q2 3,240 1,699 1,657 2,627 2,198 2,497 2,464 Q3 2,627 2,198 Q4 2,497 2,464 3,500 3,000 2,500 2,000 1,500 1,000 500 0 FY26 FY25 FY24 • Clinical Diversion Program (CDP) – Dedicated case managers serve people engaging in Court Services to improve connection to case management and social services, while also improving appearance and case completion rates. 160 140 120 100 80 60 40 20 0 FY26 FY25 FY24 116 73 63 Q1 116 73 63 CDP Clients 140 106 99 Q3 106 99 105 77 Q4 105 77 84 75 Q2 140 75 84 160 140 120 100 80 60 40 20 0 FY26 FY25 FY24 103 96 55 Q1 96 103 55 Cases Resolved 122 126 34 Q2 126 122 34 138 133 Q3 133 138 130 104 Q4 130 104 • Mobile Court – This program, initiated by Council Resolution 20230816-016, is intended to connect people in the community with solutions for resolving cases while providing immediate connection to services and resource navigation through case managers onsite. 120 100 80 60 40 20 0 FY26 FY25 FY24 54 35 20 Q1 54 20 35 Warrants Cleared 106 33 21 Q2 106 33 21 71 20 Q3 71 20 160 140 120 100 80 60 40 20 0 FY26 FY25 FY24 92 46 26 Q1 92 26 46 38 21 Q4 38 21 Cases Docketed 136 35 33 Q2 136 35 33 92 26 Q3 92 26 69 34 Q4 69 34 Homeless Services • Walk-in Case Management – Provides assistance obtaining identification documents and signing up for public benefits, access to basic needs, and linkages to mental health, physical health, and substance misuse services. Number of Walk-In CM Interactions 5,142 4,907 4,621 4,452 4,356 5,287 4,357 4,654 4,077 3,739 Q1 4,654 3,739 4,077 Q2 4,621 4,356 4,452 Q3 5,142 4,907 Q4 5,287 4,357 6,000 5,000 4,000 3,000 2,000 1,000 0 FY26 FY25 FY24 90 80 70 60 50 40 30 20 10 0 FY26 FY25 FY24 Average Daily Walk-In CM Interactions 77.6 68.04 61.2 76.99 72.98 72.42 81.61 77.74 82.6 69.13 Q1 77.6 61.2 68.04 Q2 76.99 72.42 72.98 Q3 81.61 77.74 Q4 82.6 69.13 • Intensive Case Management – Person-centered, housing-focused services with low caseloads and wrap around supports. C’s Intensive Case Management and Walk-in Case Management programs both serve as a diversion from criminal justice involvement by meeting people’s needs before situations escalate to involve law enforcement. Number of Clients Connected to Housing 25 20 15 10 5 0 FY26 FY25 FY24 19 15 8 Q1 8 15 19 10 7 6 Q2 7 6 10 23 11 Q3 23 11 21 7 Q4 7 21 *Includes ESG RRH CM as well Support Services - Responsible for special projects and support for all DACC units, administration for the department, internal and external communications, community engagement, support for the DACC Advisory Board and the Austin Homelessness Advisory Council, and social service contracting. • DACC-funded social service contracts –Long- and short-term housing solutions, SOAR application assistance and representative payee services, and substance misuse, mental health, and peer support services for clients served directly by DACC. Also includes contracts that serve the Austin Community such as the Expanded Mobile Crisis Outreach Team (EMCOT) and funding six Integral Care mental health and peer support staff that serve on the Homeless Outreach Street Team (HOST). Number of Social Service Contract Payments Processed Amount of Social Service Contract Payments Processed 60 50 40 30 20 10 0 FY26 FY25 FY24 45 39 32 Q1 32 45 39 48 37 22 Q2 22 37 48 38 35 Q3 35 38 39 34 Q4 34 39 $4,500,000 $4,000,000 $3,500,000 $3,000,000 $2,500,000 $2,000,000 $1,500,000 $1,000,000 $500,000 $3,882,680 $2,346,961 $1,904,427 $2,080,217 $1,987,705 $1,986,352 $1,687,077 $1,899,106 $1,794,754 $1,697,121 $0 FY26 FY25 FY24 Q1 $3,882,680 $1,904,427 $1,687,077 Q2 $2,346,961 $1,899,106 $2,080,217 Q3 Q4 $1,987,705 $1,794,754 $1,986,352 $1,697,121 • Austin Homelessness Advisory Council (AHAC) – Approximately 15 people with lived experience meet biweekly to provide input on policies, programs, and practices impacting people experiencing homelessness. DACC provides facilitative and administrative support to ensure AHAC can continue to serve as a vital and ongoing resource for City departments and the community. Hours of Input Gathered from AHAC Members 200 180 160 140 120 100 80 60 40 20 0 FY26 FY25 FY24 133 124 111 154 108 116 Q1 124 133 111 Q2 116 108 154 178 132 Q3 132 178 172 108 Q4 108 172