Item 2-CDC Neighborhood Service Unit Report — original pdf
Backup
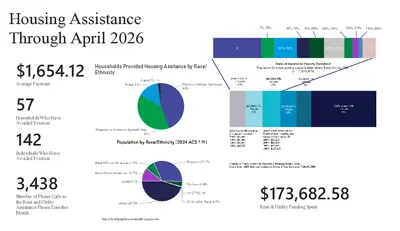
Housing Assistance Through April 2026 Power BI Desktop 1%-25% 51%-75% 76%-100% 126%-150% 151%-175% 176%-200% 0 26%-50% 101%-125% >200 $1,654.12 Average Payment Households Provided Housing Assitance by Race/ Ethnicity Asian 2% White 15% Black or African American 44% 57 Households Who Have Avoided Eviction 142 Individuals Who Have Avoided Eviction 3,438 Number of Phone Calls to the Rent and Utility Assistance Phone Line this Month Hispanic or Latino or Spanish Orig… 39% https://demographics-austin.hub.arcgis.com/ $173,682.58 Rent & Utility Funding Spent Basic Needs Assistance Through April 2026 Power BI Desktop 17,973 Services Provided 5,381 Households Served Households Served by Race/Ethnicity Top Ten Zip Codes Served 78741 78702 78723 78753 1.41% 5.84% 6.6% 15.73% 42.89% Hispanic, Latino/Latina, or Spanish No 'Race/Ethnicity' Entered Black or African American White Two or More Races Asian Prefer Not to Answer Some Other Race or Ethnicity 78744 78724 78745 (Blank) 78752 25.97% 78617 Rent/Utility Assistance By Zip Code Basic Needs Services by Zipcode Power BI Desktop © 2026 TomTom, © 2026 Microsoft Corporation © 2026 TomTom, © 2026 Microsoft Corporation © 2026 TomTom, © 2026 Microsoft Corporation © 2026 TomTom, © 2026 Microsoft Corporation Employment Services Through April 2026 Power BI Desktop 41 Annual Goal Progress Towards Annual Goal of 41 Person Transitioning Out of Poverty 19 (46.34%) Transitions Remaining Goal 19 Persons Sucessfully Transitioned Out of Poverty 22 (53.66%) 263 Number of Case Managment Services Provided Health Services Through April 2026 Power BI Desktop 140 Health Screening Events 1,332 Nursing Care Sessions