Item 4- NSU CDC 2025 — original pdf
Backup
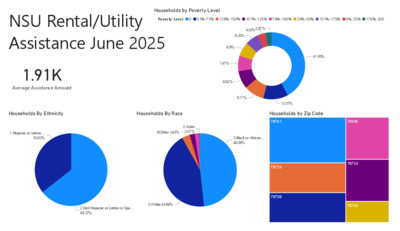
Households by Poverty Level Power BI Desktop 0 51%-75% 126%-150% 101%-125% 76%-100% 26%-50% 151%-175% 0%-25% 176%-200 NSU Rental/Utility Assistance June 2025 Poverty Level 1.91K Average Assistance Amount 4.02%2.87% 6.32% 6.9% 7.47% 8.62% 9.77% Households By Ethnicity Households By Race 1.Hispanic or Latino … 35.63% 2.Asian 6.Other 3.45% 0.57% 3.Black or African… 48.28% 2.Not Hispanic or Latino or Spa… 64.37% 5.White 43.68% 41.95% 12.07% Households by Zip Code 78741 78660 78724 78758 78753 78759 NSU Oasis Assistance June 2025 26.72K Services Provided Count of Household by Race/Ethnicity 0.57% 0% 2.03% 10.39% 15.14% 25.41% Count of Household by Food Category Power BI Desktop Count of Household by Non-Food Category Food Pantry: Montopolis (P… Food Pantry: East Aus… Market Days: Mo… Seasonal Assistance: St. John'… Clothing: East Austin… Clothing: Monto… Market Days: Dove Springs … Seasonal Assistance: Blacklan… FFFF Assistance: East … Market Days: Blac… Clothing: East Austin … Clothing: Rosew… Count of Household by Zip code 78741 78702 (Blank) Race/Ethnicity Hispanic, Latino/Latina, or Spanish No 'Race/Ethnicity' Entered Black or African American White 40.93% Hispanic, Latino/Latina, or Spanish… Asian Prefer Not to Answer Black or African AmericanWhite Some Other Race or Ethnicity Middle Eastern or North African Black or African AmericanHispanic, … 78744 78753 78724 Rent/Utility Assistance By Zip Code Oasis Services by Zipcode Power BI Desktop © 2025 TomTom, © 2025 Microsoft Corporation © 2025 TomTom, © 2025 Microsoft Corporation © 2025 TomTom, © 2025 Microsoft Corporation © 2025 TomTom, © 2025 Microsoft Corporation