Item 3_ NSU CDC April 2025 — original pdf
Backup
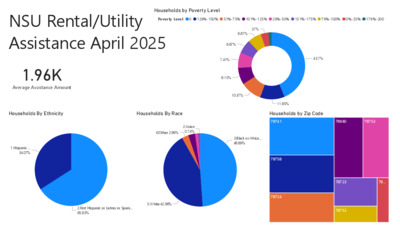
NSU Rental/Utility Assistance April 2025 Poverty Level 1.96K Average Assistance Amount Households By Ethnicity Households By Race Households by Poverty Level Power BI Desktop 0 126%-150% 51%-75% 101%-125% 26%-50% 151%-175% 76%-100% 0%-25% 176%-200 3.7% 6.67% 6.67% 7.41% 8.15% 10.37% 43.7% 1.Hispanic … 34.07% 6.Other 2.96% 2.Asian 0.74% 3.Black or Africa… 48.89% 2.Not Hispanic or Latino or Spani… 65.93% 5.White 42.96% 11.85% Households by Zip Code 78741 78660 78753 78758 78724 78723 78… 78752 NSU Oasis Assistance April 2025 14.89K Services Provided Count of Household by Race/Ethnicity 0.65% 2.22% 11.32% 15.57% 22.94% Count of Household by Food Category Power BI Desktop Count of Household by Non-Food Category Market Days: Dove Springs -… Food Pantry: Monto… FFFF Assistance: Ea… Seasonal Assistance: St. John's (HA… Clothing: East Aus… Baby Supplies… Food Pantry: East Austin (PA… Market Days: St. John's … Market Days: M… Clothing: Monto… Baby Supplies: … Clothing: East Austin (CC088) - Clot… Count of Household by Zip code 78741 78702 78753 Race/Ethnicity Hispanic, Latino/Latina, or Spanish No 'Race/Ethnicity' Entered Black or African American White 41.46% Hispanic, Latino/Latina, or Spanish… Asian Prefer Not to Answer Black or African AmericanWhite 78744 Some Other Race or Ethnicity Middle Eastern or North African Black or African AmericanPrefer No… 78752 78724 Rent/Utility Assistance By Zip Code Oasis Services by Zipcode Power BI Desktop © 2025 TomTom, © 2025 Microsoft Corporation © 2025 TomTom, © 2025 Microsoft Corporation © 2025 TomTom, © 2025 Microsoft Corporation © 2025 TomTom, © 2025 Microsoft Corporation