Item 4_NSU CDC 2025 March 2025 — original pdf
Backup
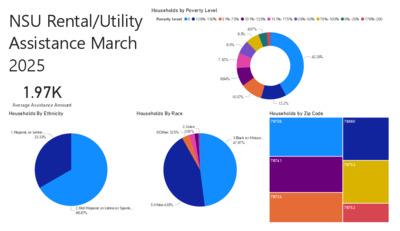
Households by Poverty Level Power BI Desktop Poverty Level 0 126%-150% 51%-75% 101%-125% 151%-175% 26%-50% 76%-100% 0%-25% 176%-200 NSU Rental/Utility Assistance March 2025 1.97K Average Assistance Amount Households By Ethnicity 1.Hispanic or Latino … 33.33% Households By Race 2.Asian 6.Other 3.25% 0.81% 4.07% 6.5% 6.5% 7.32% 8.94% 10.57% 3.Black or African… 47.97% 42.28% 12.2% Households by Zip Code 78758 78660 78741 78724 78753 78752 2.Not Hispanic or Latino or Spanis… 66.67% 5.White 43.9% Count of Household by Food Category Power BI Desktop Count of Household by Non-Food Category Food Pantry: East Austin (P… Food Pantry: Monto… Market Days: St. Jo… Seasonal Assistance: St. John's (HA251) -… Clothing: East… Clothing: Ea… Market Days: Dove Springs … FFFF Assistance: East Aus… Food Pantry: S… FFFF Assistance: St. John's (FF251) - FFFF Clothing: Mo… Baby Supplie… NSU Oasis Assistance March 2025 10.02K Services Provided 0.63% 2.04% 10.5% 15.33% 24.5% Count of Household by Race/Ethnicity Count of Household by Zip code 78741 78753 78752 41.33% Hispanic, Latino/Latina, or Spanish… Race/Ethnicity Hispanic, Latino/Latina, or Spanish No 'Race/Ethnicity' Entered Black or African American White Asian Prefer Not to Answer Some Other Race or Ethnicity Black or African AmericanWhite Middle Eastern or North African Black or African AmericanPrefer No… 78702 78744 78723 78724 Rent/Utility Assistance By Zip Code Oasis Services by Zipcode Power BI Desktop © 2025 TomTom, © 2025 Microsoft Corporation © 2025 TomTom, © 2025 Microsoft Corporation © 2025 TomTom, © 2025 Microsoft Corporation © 2025 TomTom, © 2025 Microsoft Corporation