Item 2- NSU CDC JAN 2025 — original pdf
Backup
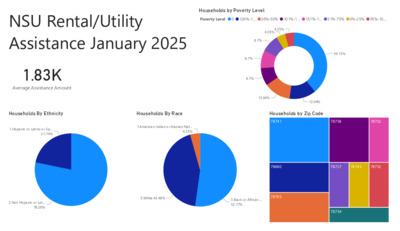
Households by Poverty Level Power BI Desktop Poverty Level 0 126%-1… 26%-50% 101%-1… 151%-1… 51%-75% 0%-25% 76%-10… NSU Rental/Utility Assistance January 2025 1.83K Average Assistance Amount 4.35% 4.35% 8.7% 8.7% 8.7% Households By Ethnicity Households By Race Households by Zip Code 1.Hispanic or Latino or Sp… 21.74% 1.American Indian or Alaskan Nat… 4.35% 13.04% 13.04% 78741 78758 78702 78660 78727 78745 78752 2.Not Hispanic or Lat… 78.26% 5.White 43.48% 3.Black or African … 52.17% 78705 39.13% 78754 Count of Household by Food Category Power BI Desktop Count of Household by Non-Food Category Food Pantry: East Austin (PA08… Market Days: St. Jo… FFFF Assistance: … Clothing: East Austin (CK088) - Coats for Kids Clothing: R… Clothing: R… NSU Oasis Assistance January 2025 Count of Household by Race/Ethnicity 2061 Services Provided 0.49% 2.28% 6.84% Food Pantry: Montopolis (PA18… Market Days: Blac… FFFF Assistance: … Baby Supplies: East Austin… FFFF Assistance: St. John's (FF251) - FFFF Clothing: Montopolis (AD… Count of Household by Zip code 78741 78724 78752 Race/Ethnicity Hispanic, Latino/Latina, or Spanish No 'Race/Ethnicity' Entered Black or African American Hispanic, Latino/Latina, or Spanish… White Asian Some Other Race or Ethnicity Black or African AmericanWhite 78702 Prefer Not to Answer Black or African AmericanHispanic, … Black or African AmericanPrefer No… 78723 78753 16.55% 45.95% 22.51% Rent/Utility Assistance By Zip Code Oasis Services by Zipcode Power BI Desktop © 2025 TomTom, © 2025 Microsoft Corporation © 2025 TomTom, © 2025 Microsoft Corporation © 2025 TomTom, © 2025 Microsoft Corporation © 2025 TomTom, © 2025 Microsoft Corporation