The City of Austin is committed to compliance with the American with Disabilities Act. Reasonable modifications and equal access to communications will be provided upon request. Meeting locations are planned with wheelchair access. If requiring Sign Language Interpreters or alternative formats, please give notice at least three days before the meeting to Toye Goodson, Austin Energy, at (512) 322-6450. TTY users route through Relay Texas at 711. AUSTIN GENERATION RESOURCE PLANNING TASK FORCE JUNE 4, 2014 2:30 PM AUSTIN CITY HALL – ROOM 1029 (BULLPEN) 301 W. SECOND STREET AUSTIN, TEXAS 78701 MEMBERS:Michael Osborne, Chair Barry Dreyling, Vice Chair Clay Butler Carol Biedrzycki Grace Hsieh Cyrus Reed Mike Sloan Tom “Smitty” Smith Michele Van Hyfte For more information: http://www.austintexas.gov/content/austin-generation-resource-planning-task-force AGENDA CALL TO ORDER – June 4, 2014 at 2:30 p.m. APPROVAL OF MINUTES 1. Approval of minutes of the May 28, 2014 and May 29, 2014 meetings CITIZEN COMMUNICATION: GENERAL The first five speakers signed up prior to the meeting being called to order will each be allowed a three-minute allotment to address their concerns regarding items not posted on the agenda. BRIEFINGS AND REPORTS 2. Report on the Austin Climate Protection Plan from the City’s Office of Sustainability 3. Presentation on Climate Change Science from Dr. Kerry H. Cook, Jackson School of Geosciences, University of Texas 4. Presentation on EPA carbon rules and other pollutants by Al Armendariz, former EPA Region 6 Director 5. Presentation on solutions for the Austin Climate Protection Plan from Joep Meijer, President, theRightenvironment 6. Briefing on green pricing, community solar and other voluntary programs from Austin Energy (Related to Item #16) 7. Briefing on the methodology for determining the value of utility solar generation from Austin Energy (Related to Item #15) The City of Austin is committed to compliance with the American with Disabilities Act. Reasonable modifications and equal access to communications will be provided upon request. Meeting locations are planned with wheelchair access. If requiring Sign Language Interpreters or alternative formats, please give notice at least three days before the meeting to Toye Goodson, Austin Energy, at (512) 322-6450. TTY users route through Relay Texas at 711. 8. Report from the Austin Water Resource Planning Task Force OLD BUSINESS 9. Discussion of past Austin Energy presentation regarding wholesale real time market purchases (Item #4 on May 7, 2014 agenda) and net market purchases expressed as a percentage of Austin Energy load 10. …
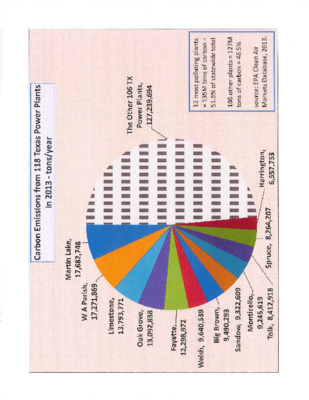
Page 1 of 2 The Austin Generation Resource Planning Task Force (‘the Task Force’) convened in a meeting at Austin City Hall, Room 1029, 301 West Second Street, Austin, Texas. CALL TO ORDER – Michael Osborne called the meeting to order at 2:33 p.m. Task Force members in attendance: Carol Biedrzycki, Clay Butler, Barry Dreyling, Michael Osborne, Cyrus Reed and Michele Van Hyfte. Mike Sloan and Tom “Smitty” Smith were not present at the Call to Order, but arrived shortly afterwards. Grace Hsieh was absent. APPROVAL OF MINUTES 1. The motion to approve minutes of the May 28, 2014 meeting, by Ms. Biedrzycki and seconded by Mr. Dreyling, passed on a vote of 6-0 with Mr. Sloan and Mr. Smith off the dais and Ms. Hsieh absent. CITIZEN COMMUNICATION: GENERAL The following persons addressed the Task Force: Dale Bulla – said that water was critical to energy generation, urged more emphasis on storage, wanted air monitoring at power plants and a rethinking of AE’s business model. Pliny Fisk – presented information about how climate change causes natural disasters and Texas ranks tops in the number of natural disasters; also said the material used in frackng could be used to make stronger, more efficient buildings. BRIEFINGS AND REPORTS 2. Report on the Austin Climate Protection Plan by Lucia Athens and Zach Baumer, Office of Sustainability. Mr. Osborne suggested taking up Item 8, the report from the Water Resource Planning Task Force. 8. Report from the Austin Water Resource Planning Task Force by Tommy Mason, Vice Chair. 3. Presentation on Climate Change Science by Dr. Kerry H. Cook, Jackson School of Geosciences, University of Texas. 4. Presentation on EPA carbon rules and other pollutants by Al Armendariz, former EPA Region 6 Director. 5. Presentation on solutions for the Austin Climate Protection Plan by Joep Meijer, President, theRightenvironment. Mr. Osborne suggested taking up Items 7 and 10, briefings from Austin Energy. 7. Briefing on the methodology for determining the value of utility solar generation from Austin Energy (Related to Item #15) 10. Discussion of past Austin Energy presentation regarding present and future costs associated with each generation resource (Item #2 on May 7, 2014 agenda). Khalil Shalabi, VP, Market Operations and Resource Planning, and Sathibabu “Babu” Chakka, Manager, Energy Market Analysis, provided briefings and answered questions from Task Force members. Mr. Osborne suggested taking up Item 6, a briefing from Austin Energy. 6. …
Resolution 20140410-024 Net-zero community-wide GHG emissions by 2050 June 2014 1 Resolution 20140410-024 Emission Sources and Goals Process and Plan Agenda 2 Council established goal: Net-zero community-wide greenhouse gas emissions by 2050 Prefers to achieve as soon as feasible Emission reductions accomplished sooner are more important Review goals & objectives in 2007 Climate resolution Recommend: Measurable interim targets starting with 2020, periodically to 2050 How and when annual progress reports will occur How often to conduct comprehensive updates to the climate plan Council Resolution 3 Council resolution timeline 1.Framework – May - September 2014 a)Interim targets b)Framework for meeting targets c)Progress update to City Council 2.Final Plan – October 2014 - March 2015 a)Focused actions and reduction calculations b)Combine emission reductions and climate resiliency into one comprehensive plan document c)Presented for Community review and council adoption 3.Implementation Plan a)Specific actions b)Costs and schedules c)Data tracking 4 Resolution 20140410-024 Energy Power plants in and outside of Travis county Natural gas burned for heat Transportation CAMPO estimates of Travis County vehicle miles traveled scaled to an annual basis Waste & manufacturing Wastewater, landfills, cement manufacturing, and semiconductor PFCs 2010 Travis County GHG Inventory 15.2 Million metric tons CO2e 5 Developed using the ICLEI U.S. Community GHG Protocol, 2012 Growth v. Goal 6 Public Input Sessions Reviewed by Relevant Boards and Commissions Consideration of results of 2014 Generation Plan Task Force Formation of Technical Advisory Groups to work with city staff to develop action plans Stakeholder Process 7 Community Climate Steering Committee Energy Technical Advisory Group Transportation Technical Advisory Group Waste Technical Advisory Group Industry Technical Advisory Group Organization 8 TAG Purpose: Create and distill the strategies, actions, and sub-measures for each sector Sector plans should include GHG emissions resulting from existing plans Short & long term actions Secondary goals & measures for sector specific factors (VMT, renewables, etc.) Feasibility & how other sectors could make up for shortfalls Take into account Population and business growth Available and emerging technology Potential costs and benefits Climate preparedness and resilience Barriers where the City does not exert direct control over community emissions Technical Advisory Group Action Plans 9 May – Planning Departmental briefings, setup, and participant identification June – Kicking Off Late June kickoff meeting with all stakeholders July – Initial Work TAGs defining boundaries and overarching strategies Steering Committee defining boundaries and reviewing targets August – Progress Strategies, actions, goals defined and beginning …
Climate Change and Austin Kerry H. Cook Department of Geological Sciences The University of Texas at Austin Presentation to: Austin Generation Resource Planning Task Force June 4, 2014 Austin City Hall Projections from Regional Model Simulations Cross-checked with IPCC projections on coarser resolution and validated against observation of current climate Outer domain with 90-km resolution (~10,000 grid points) Inner domain with 30-km resolution (~7,500 gridpoints) Climate models are governed by the laws of physics: F = ma 1st law of thermo conservation of mass for air conservation of mass for water vapor heat balance calculation at the surface Two 20-year simulations •1981 – 2000 late 20th century Observed lateral and surface boundary conditions; observed greenhouse gas concentrations (340 ppm to 371 ppm) •2041 – 2060 mid 21st century Observed lateral and surface boundary conditions + anomalies; CO2 increased (533 ppm to 578 ppm according to an IPCC business-as-usual emissions scenario) References: Patricola, C. M., and K. H. Cook, 2013a: Mid-twenty first century climate change in the central United States. Part I: Regional and global model predictions. Climate Dynamics, 40, 551-568. Patricola, C. M., and K. H. Cook, 2013b: Mid-twenty first century climate change in the central United States. Part II: Climate change processes. Climate Dynamics, 40, 569-583. Projections for 2050: Surface Temperature Difference (°F) Business-as-Usual Emissions Annual Mean Winter Spring Fall Summer Source: Professor Kerry H. Cook, Dept. Geological Sciences, The University of Texas at Austin Changes in the number of 100°F days for the Austin area late 20th c. mid 21st c. Source: Professor Kerry H. Cook, Dept. Geological Sciences, The University of Texas at Austin 2040-2060 1980-2000 90 < A < 105 “extreme caution” fatigue, heat cramps 105 < A < 120 “danger” heat exhaustion likely 120 > A “extreme danger” heat stoke imminent Heat Stress Categories: Apparent Temperature (A) Projected monthly changes in the number of Extreme Caution and Danger heat stress days for the Greater Austin averaging region (30°N-30.5°N; 97°W-98.5°W) late 20th c. mid 21st c. Change in extreme caution heat stress days Change in danger heat stress days 2040-2060 2040-2060 1980-2000 1980-2000 Annual Precipitation Differences (%) 7.5% reduction in annual rainfall (blue triangle = Austin) Source: Professor Kerry H. Cook, Dept. Geological Sciences, The University of Texas at Austin Seasonal Precipitation Differences (%) Summer: 15% reduction Winter: 5% reduction Source: Professor Kerry H. Cook, Dept. Geological Sciences, The University of Texas at Austin Two sources …
The Austin Climate Protection Plan 2014 – intent and implications Joep Meijer, CEO The Right Environment Co-Founder Climate Buddies, Austin resident 6/4/2014 Austin Generation Resource Planning Taskforce Meijer, ACPP2014 About this presentation •This presentation is about intent, interpretation, potential implications •None of the data presented is vetted by Austin Energy •It is a framing document •It includes recommendations tocreate clarity about the relation of the ACCP2014 and the Taskforce recommendations 6/4/2014 Austin Generation Resource Planning Taskforce Meijer, ACPP2014 10 2009 Travis County 15,000,000 You Proposed Austin Climate Protection Plan 2014 Direct greenhouse gas emissions Expressed in metric tons CO2eq 6/4/2014 Austin Generation Resource Planning Taskforce Meijer, ACPP2014 -300 Improving the Climate Generation Home Solar PV 7 Community solar projects 2 Utility scale wind projects 5 Community wind projects Solar for 500 African families and farmers Use NET Positive home – 8 solar panels, < 2,000 kWh Electric car – 12 solar panels , 12,000 miles Sequestration 2000 Trees planted in Mala Atlanta 1000 Trees planting in Amazonas 10 hectares Forest preservation in Costa Rica Me + wife Proposed Austin Climate Protection Plan 2014 Direct greenhouse gas emissions Expressed in metric tons CO2eq 6/4/2014 Austin Generation Resource Planning Taskforce Meijer, ACPP2014 -300 Participants speak up! Susan Adams - When my family started the carbon diet program, we felt like we were doing pretty well and had little to learn about improving our carbon footprint. Were we wrong! We lost more than 20,000 pounds on the carbon diet and see the world through different eyes. The program outlined all kinds of simple ways to reduce our carbon footprint, while reducing our bills at the same time. The meetings were a great way to hear what actions other people were taking and to get their ideas and support. Carbon Diet Program Lose 5,000 lbs of your carbon footprint in 6 weeks! 6/4/2014 Austin Generation Resource Planning Taskforce Meijer, ACPP2014 -300 Interfaith Energy Action Team Becoming Carbon Positive – a manual for houses of worship 6/4/2014 Austin Generation Resource Planning Taskforce Meijer, ACPP2014 2009 GHG impact 6/4/2014 Austin Generation Resource Planning Taskforce Meijer, ACPP2014 Travis County 2009 greenhouse gas emissions per sector Cars and trucks Austin Energy Other electrcity Natural gas Landfill Semiconductors Lime manufacturing Off-road vehicles 6/4/2014 Austin Generation Resource Planning Taskforce Meijer, ACPP2014 Stakeholders •Energy (52%) –Austin Energy (36%) –Third party owned CHP (8%) –Natural gas (8%) •Transportation (36%) –Cars and trucks …
PRESENTATION TITLE Slide Title Community Solar Update Danielle Murray, Manager, Solar Energy Services Presentation to Generation Task Force June 4, 2014 ® CLEAN, AFFORDABLE, RELIABLE ENERGY & EXCELLENT CUSTOMER SERVICE Community Solar Overview Community Solar will provide access to solar energy for customers unable to install solar panels on their own homes or dwellings. Renters and homeowners/condo dwellers with shaded roofs Customers unable to make the upfront investment in rooftop systems Local solar photovoltaic projects will be developed to supply solar energy for this program. Supporting Austin's Climate Protection Plan, and local solar goals Allows participants to receive the benefits of solar power without actually owning/hosting the solar panels on-site 2 Community Solar RFP Timeline Community Solar RFP released Feb 24 For construction, operation and maintenance of up to 4 MW (AC) PV to be constructed at the Kingsbery site PPA structure with AE as off-taker RFP closes May 14 Expect ~6 weeks to review and begin negotiations; 6-10 weeks from RFP close to award Contract approval at Council in August Break ground on site fall 2014 Expected online date: Q2 2015 3 Kingsbery Site 4 Kingsbery Site 5 •Fenced perimeter •Visitor Parking •Educational Kiosk at viewing area •Educate on solar power production •Acknowledge program participants •Provide array details •Display production in real-time •Web cam on-site so that interested customers can view the installation as it occurs Preliminary Program Design Basics: Opt-in program ■ Residential only (to start) Portable within AE territory Not transferable to other customers/accounts Key Considerations: Easy to understand ■ Easy to integrate with billing Cost recovery ■ Scalable Meet customer desires ■ Create attractive program 6 Program Models Under Consideration Subscription models Percent of customer’s monthly bill (e.g. 25%, 50%, 75% or 100%) Monthly kWh block (e.g. in 250kWh increments) Capacity (kW) block (e.g. in 1 kW increments) Pricing Models Fixed premium model Community Solar subscribers sign up for a rate set at a constant premium over the regular Power Supply Adjustment (PSA). Variable cost model Community Solar subscribers sign up for a rate for the solar energy at a price reflective of the cost to AE for procuring the solar energy (adjusted annually based on portfolio of community solar PPAs) and also receive a credit at the prevailing Value of Solar Rate. 7 Questions? Comments? Suggestions? What do customers want out of a community solar program? What are key program design elements you’d like to …
June 4, 2014 June 4, 2014 Austin Energy Update to Austin Generation Resource Planning Task Force Babu Chakka - Manager, Energy Market Analysis John Wester - Manager, Energy Supply & Risk Management INVESTING IN A CLEAN FUTURE June 4, 2014 Agenda •Austin Energy all-in historical production cost/revenue for Gas and Wind units •Recap of the Methodology review with LSAC Experts •Resource Planning Guiding Principals 3 INVESTING IN A CLEAN FUTURE June 4, 2014 Austin Energy All in Production Cost/Revenue for Gas units 4 $0$20$40$60$80$100$120$140Millions of Dollars (M$)Total Natural Gas GenerationNon-Fuel CostFuel CostMarket RevenueGenerationMWhFuel Cost($Million)Non-Fuel Cost($Million)Total Cost($Million)Total Cost($/MWH)Total Revenue ($Million)Total Revenue ($/MWH)Net Revenue/Cost ($Million)Net Revenue/Cost ($/MWH)CY 20111,760,176$116.3$28.6$144.8$82.28$242.7 $137.87 $97.8 $55.59CY 20121,388,101$75.0$33.7$108.7$78.32$94.3 $67.95 ($14.4)($10.37)Summary INVESTING IN A CLEAN FUTURE June 4, 2014 Austin Energy Renewable Energy Cost/Revenue for Wind 5 $0$1$2$3$4$5$6$7$8$9$10Millions of Dollars (M$)Total WindPPA CostMarket RevenueOther costs such as Congestion cost & contract sharing cost are not included here The totals shown here is in Calendar year and will be different from the previous update which is in Fiscal year GenerationMWhPPA Cost($Million)Non-Fuel Cost($Million)Total Cost($Million)Total Cost($/MWH)Total Revenue ($Million)Total Revenue ($/MWH)Net Revenue/Cost ($Million)Net Revenue/Cost ($/MWH)CY 20111,294,451$49.4$0.0$49.4$38.15$33.3 $25.69 ($16.1)($12.46)CY 20121,845,660$73.3$0.0$73.3$39.70$37.0 $20.07 ($36.2)($19.63)Summary INVESTING IN A CLEAN FUTURE June 4, 2014 Solar PV Cost/Benefit Approach (LSAC Review) 6 •Based on the expected annual cash flow for AE –Forecast period: 2014 to 2020 –Outflows: Payments going out –Inflows: Revenues coming in •Outflows (i.e. cost) –Residential: Value of Solar (VOS) rate x kWh + rebate –Commercial: (PBI + average base rates) x kWh –Community PV: Purchased Power Agreement (PPA) x kWh –Utility PV: Purchased Power Agreement (PPA) x kWh •Inflows (i.e. revenues/benefits/avoided costs) –Solar PV hourly output kWh x AE load zone hourly LMP –Community PV also includes •2% ERCOT transmission losses •AE 4 CP transmission TCOS savings –Adjustments already accounted for VOS and net meter for Residential/Commercial INVESTING IN A CLEAN FUTURE June 4, 2014 Solar PV Scenarios Considered (LSAC Review) 7 2020 Scenario MW Local Utility Scale 2020 Goal Residential Commercial Community Total Wholesale Existing 48 MW 9.9 8.1 18 30 Current Goal (200 MW) 38 39 10 87 113 200 Inc. to 400 MW (LSAC Recommendation) 50 50 100 200 200 400 Inc. to 600 MW (LSAC Recommendation) 50 50 200 300 300 600 INVESTING IN A CLEAN FUTURE June 4, 2014 Solar PV Scenarios – Assumptions (LSAC Review) 8 INVESTING IN A CLEAN FUTURE June 4, 2014 Estimated Cumulative Net Impact (LSAC Review) …