Backup — original pdf
Backup

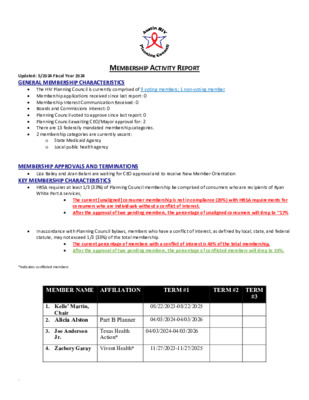
MEMBERSHIP ACTIVITY REPORT The HIV Planning Council is currently comprised of 9 voting members; 1 non‐voting member Updated: 5/2024 Fiscal Year 2024 GENERAL MEMBERSHIP CHARACTERISTICS Membership applications received since last report: 0 Membership Interest Communication Received: 0 Boards and Commissions interest: 0 Planning Council voted to approve since last report: 0 Planning Council awaiting CEO/Mayor approval for: 2 There are 13 federally mandated membership categories. 2 membership categories are currently vacant: o o State Medicaid Agency Local public health agency MEMBERSHIP APPROVALS AND TERMINATIONS Liza Bailey and Aran Belani are waiting for CEO approval and to receive New Member Orientation KEY MEMBERSHIP CHARACTERISTICS White Part A services. HRSA requires at least 1/3 (33%) of Planning Council membership be comprised of consumers who are recipients of Ryan The current [unaligned] consumer membership is not in compliance (20%) with HRSA requirements for consumers who are individuals without a conflict of interest. After the approval of two pending members, the percentage of unaligned consumers will drop to ~17% In accordance with Planning Council bylaws, members who have a conflict of interest, as defined by local, state, and federal statute, may not exceed 1/3 (33%) of the total membership. The current percentage of members with a conflict of interest is 40% of the total membership. After the approval of two pending members, the percentage of conflicted members will drop to 33%. *Indicates conflicted members AFFILIATION TERM #1 TERM #2 TERM MEMBER NAME 1. Kelle’ Martin, Chair 08/22/2023-08/22/2025 2. Alicia Alston Part B Planner 04/03/2024-04/03/2026 3. Joe Anderson Jr. Texas Health Action* 04/03/2024-04/03/2026 4. Zachery Garay Vivent Health* 11/27/2023-11/27/2025 #3 . MEMBERSHIP ACTIVITY REPORT 08/24/2023-08/24/2025 ASHwell* 04/03/2024-04/03/2026 7. Judith Hassan 04/03/2024-04/03/2026 5. Ashley Garling 6. Marquis Goodwin Project Transitions* Black Trans Leadership of Austin 8. Rocky Lane 9. Kristina McRae Thompson 10. Gin Pham 11/27/2023-11/27/2025 10/06/2020- 10/06/2022 06/23/2022- 06/23/2024 10/06/2022- 10/06/2024 . MEMBERSHIP ACTIVITY REPORT Planning Council/Planning Body Reflectiveness (Use HIV/AIDS Prevalence data as reported in your FY 2023 Application) HIV Prevalence in EMA/TGA Total Members of the PC/PB Unaligned RWHAP Clients on PC/PB Number Number Number Percentage (include % with # ) Percentage (include % with # ) Percentage (include % with # ) Race/Ethnicity White, not Hispanic Black, not Hispanic Hispanic Asian/Pacific Islander American Indian/Alaska Native Multi‐Race Other/Not Specified 2566 1443 2356 0 0 243 100 Total 6708 Male Female Transgender: male‐to‐female Transgender: female‐to‐male Additional gender identity Total 5523 922 0 0 0 6445 38.25% 21.51% 35.12% 0.00% 0.00% 3.62% 1.49% 100% 85.69% 14.31% 0.00% 0.00% 0.00% 100% Percentage (include % with # ) Percentage (include % with # ) 1 5 1 1 0 0 1 9 3 3 0 1 2 9 0 2 0 0 0 0 0 2 0 1 0 0 1 2 22.22% 44.44% 22.22% 11.11% 0.00% 0.00% 0.00% 100% Percentage (include % with # ) 44.44% 22.22% 0.00% 11.11% 22.22% 100% Percentage (include % with # ) 50.00% 50.00% 0.00% 0.00% 0.00% 0.00% 0.00% 100% Percentage (include % with # ) 50.00% 50.00% 0.00% 0.00% 0.00% 100% Percentage (include % with # ) Age Number Number Number . 13‐24 years 25‐34 years 35‐44 years 45‐54 years 55‐64 years 65+ years Total 203 1067 888 693 472 150 3473 5.85% 30.72% 25.57% 19.95% 13.59% 4.32% 100% 0 3 6 0 0 0 9 0.00% 33.33% 55.56% 0.00% 11.11% 0.00% 100% 0 0 2 0 0 0 2 0.00% 0.00% 50.00% 0.00% 50.00% 0.00% 100% Gender Number Number Number MEMBERSHIP ACTIVITY REPORT DEMOGRAPHIC SNAPSHOT of PLANNING COUNCIL MEMBERSHIP VS. PWH PREVALENCE IN AUSTIN TGA The purpose of the chart below is to ensure Planning Council membership is consistent with, but not necessarily mirrors the local PLWHA Profile. HRSA’s expectation and policy is that Planning Council membership is REFLECTIVE OF THE AREA’S HIV/AIDS PREVALENCE. *one Planning Council member has opt‐ed to be omitted from the demographic snapshot Source: RWHAP Annual Client‐Level Data Report, 2018 / ARIES Statistical Analysis Report (STAR) – Results Note: Percentage may not total 100% in some areas due to rounding .