Backup — original pdf
Backup
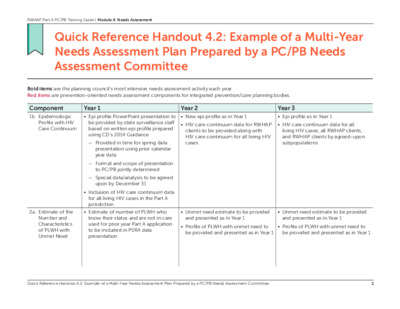
Quick Reference Handout 4.2: Example of a Multi-Year Needs Assessment Plan Prepared by a PC/PB Needs Assessment Committee Bold items are the planning council’s most intensive needs assessment activity each year. Red items are prevention-oriented needs assessment components for integrated prevention/care planning bodies. Component 1b. Epidemiologic Profile with HIV Care Continuum Year 1 • Epi profile PowerPoint presentation to be provided by state surveillance staff based on written epi profile prepared using CD’s 2014 Guidance Year 2 • New epi profile as in Year 1 Year 3 • Epi profile as in Year 1 • HIV care continuum data for RWHAP clients to be provided along with HIV care continuum for all living HIV cases • HIV care continuum data for all living HIV cases, all RWHAP clients, and RWHAP clients by agreed-upon subpopulations — Provided in time for spring data presentation using prior calendar year data — Format and scope of presentation to PC/PB jointly determined — Special data/analysis to be agreed upon by December 31 • Inclusion of HIV care continuum data for all living HIV cases in the Part A jurisdiction 2a. Estimate of the Number and Characteristics of PLWH with Unmet Need • Estimate of number of PLWH who • Unmet need estimate to be provided • Unmet need estimate to be provided know their status and are not in care used for prior year Part A application to be included in PSRA data presentation and presented as in Year 1 and presented as in Year 1 • Profile of PLWH with unmet need to • Profile of PLWH with unmet need to be provided and presented as in Year 1 be provided and presented as in Year 1 Quick Reference Handout 4.2: Example of a Multi-Year Needs Assessment Plan Prepared by a PC/PB Needs Assessment Committee 1 RWHAP Part A PC/PB Training Guide | Module 4: Needs Assessment Year 1 • New estimate to be provided for Year 2 Year 3 Component 2a. Estimate of the Number and Characteristics of PLWH with Unmet Need CONTINUED 2b. Estimate of the Number and Characteristics of Individuals with HIV Who Do Not Know Their Status (Unaware) 3a. Assessment of Service Needs and Barriers: PLWH in Care inclusion in Part A application, using estimation method specified by HRSA/HAB—presentation to be made at Needs Assessment Committee and then at PC meeting in the fall • Profile of PLWH with unmet need including available demographics and county of residence to be provided and presented by surveillance staff in the fall along with the estimate of unmet need • Surveillance staff to provide an estimate of the number of HIV+/unaware in the jurisdiction and include it in the data presentation along with HIV care continuum data • PC to conduct a PLWH Survey to reach at least 500 individuals (or x percentage, depending on number in jurisdiction) representative of all PLWH in the jurisdiction and prepare report — Use sampling that generates a representative sample — Include questions on other health conditions • Surveillance staff to provide an estimate of the number of HIV+/unaware in the jurisdiction as in Year 1 • Surveillance staff to provide an estimate of the number of HIV+/unaware in the jurisdiction as in Year 1 • Surveillance staff to identify groups of PLWH most likely to be unaware based on analysis of data on: — Number and characteristics of late testers — Number and characteristics of recently diagnosed PLWH • Conduct additional analysis of survey data along with service utilization and client characteristics data, to further explore key identified issues • Conduct focus groups as special studies to reach 12-20 PLWH from each of at least 5 targeted PLWH populations and from HIV-negative individuals with identified risk Quick Reference Handout 4.2: Example of a Multi-Year Needs Assessment Plan Prepared by a PC/PB Needs Assessment Committee 2 RWHAP Part A PC/PB Training Guide | Module 4: Needs Assessment Year 1 Year 2 Year 3 Component 3a. Assessment of Service Needs and Barriers: PLWH in Care CONTINUED 3b. Assessment of Service Needs and Barriers: PLWH Out of Care — Put survey on tablets and laptops and use peers to help with survey administration — For integrated planning bodies, include questions about need for and access to prevention for positives and include questions on HIV education and prevention experiences for PLWH diagnosed in the past 3 years • PC to do targeted studies using the PLWH survey questions or special tools — With help from providers and PLWH groups, target and include at least 25 PLWH from each of 5-8 identified target populations [e.g., immigrants, young African American MSM, transgender PLWH, Latinas, Homeless PLWH, recently incarcerated PLWH, youth transi- tioning to adult care, individuals from low-incidence counties in the service area) • Include questions on PLWH survey for individuals who entered or returned to care in the past 6 months • Include questions about past or • PC to carry out a special study to current out-of-care status as part of special studies assessing service needs and barriers identify and survey at least 150 PLWH who know their status and are not in care or who re-entered care within the past 6 months to determine their service experiences, needs, barriers, reasons for being out of care, and factors that would help them return to care, tabulate and analyze data, and prepare a report and summary presentation for PSRA Quick Reference Handout 4.2: Example of a Multi-Year Needs Assessment Plan Prepared by a PC/PB Needs Assessment Committee 3 RWHAP Part A PC/PB Training Guide | Module 4: Needs Assessment Component 4. Resource Inventory Year 1 • Develop an updated resource Year 2 • Update resource inventory Year 3 • Update resource inventory • Work with recipient to make resource inventory user friendly, searchable, and available online for use by providers and clients inventory — Review resource inventory data from HRSA/CDC Integrated HIV Prevention and Care Plan — Use existing resource guide for consumers if one exists — Work with PC support staff to obtain updated information from identified service providers with and without RWHAP funding — Add full addresses and telephone numbers of providers along with services provided and other basic information — Format resource inventory for easy use 5. Profile of Provider Capacity and Capability • Review PLWH survey findings to identify accessibility and appropriateness issues that should be addressed in the tool used to develop the profile of provider capacity and capability • PC to implement a survey to generate a profile of provider capacity and capability — Begin with list from resource inventory • Work with recipient to update information • Do follow up with providers to identify changes in services provided or populations targeted and update profile — Include RWHAP-funded and non- funded providers of HIV-related core medical and support services — Obtain, review and use questions from profile tools developed by other jurisdictions — Include questions about prevention as well as care services — Do follow-up interviews to ensure responses from RWHAP subrecipi- ents and other major provider Quick Reference Handout 4.2: Example of a Multi-Year Needs Assessment Plan Prepared by a PC/PB Needs Assessment Committee 4 RWHAP Part A PC/PB Training Guide | Module 4: Needs Assessment Year 3 Year 2 • Develop an aggregate profile of provider capability and capacity and identify issues related to the availability, accessibility, and appropriateness of services • Use data from survey to add information on service hours, languages spoken, and other detail to the resource inventory • Analysis and documents preparation • Analysis and documents preparation as in Year 1 as in Year 1 Year 1 Component 5. Profile of Provider Capacity and Capability CONTINUED 6. Assessment of Service Needs and Gaps: Analysis and Review of All Needs Assessment Data • Needs Assessment Committee to review data, identify key findings, and prepare a summary matrix of findings, a written needs assessment findings summary, and a PowerPoint summary for use in the data presentation for PSRA — Include information on service utilization and client characteristics from the recipient in the review and analysis This resource was prepared by JSI Research & Training Institute, Inc. and EGM Consulting, LLC, and supported by the Health Resources and Services Administration (HRSA) of the U.S. Department of Health and Human Services (HHS) under grant number U69HA30795: Ryan White HIV/AIDS Program Planning Council and Transitional Grant Area Planning Body Technical Assistance Cooperative Agreement. This information or content and conclusions are those of the author(s) and should not be construed as the official position or policy of, nor should any endorsements be inferred by HRSA, HHS or the U.S. Government. Quick Reference Handout 4.2: Example of a Multi-Year Needs Assessment Plan Prepared by a PC/PB Needs Assessment Committee 5 RWHAP Part A PC/PB Training Guide | Module 4: Needs Assessment Needs Assessment Report – Quick Reference Sheet Epidemiological Profile of Austin Transitional Grant Area • Latest estimate of undiagnosed People Living with HIV created in 2019 by Texas Department of State Health Services (DSHS). o Texas DSHS HIV Surveillance estimated 8,000 total PLWH and recorded 6756 diagnosed PLWH in 2019. Therefore, there was ~ 1250 living without a diagnosis. From 2019 to 2022, there was growth in the number of diagnosed PLWH from 6756 to 7568, which is an ~15% growth. o A 15% increase of ~1250 is approximately ~1440 living without a diagnosis. Please keep in mind that this is an estimate and assumes that the growth rate remained constant from 2019 to 2022. The Office of Support is asking for an updated estimate of undiagnosed PLWH in the FY25 Data Request to Texas DSHS. The Table below provides an overview of the demographics of Diagnosed PLWH in Austin TGA: People living with Diagnosed HIV by Specified Demographics in Austin TGA Total Sex at birth Female Male Gender identity Current Age 0-14 15-24 25-34 35-44 45-54 55-64 65+ Race/Ethnicity 2013 2014 2015 2016 2017 2018 2019 2020 2021 2022 5488 5663 5857 6120 6346 6529 6756 6938 7175 7568 803 823 842 877 901 927 970 980 1002 1028 4685 4840 5015 5243 5445 5602 5786 5958 6173 6540 Transgender Women Transgender Men Cisgender Women Cisgender Men Additional Gender Identity 68 0 71 0 72 1 76 1 86 1 80 1 87 1 97 105 103 1 2 2 803 823 841 876 900 926 969 979 1000 1026 4617 4769 4943 5167 5359 5522 5699 5861 6068 6433 0 0 0 0 0 0 0 0 0 4 5 19 17 18 18 15 13 13 12 11 227 248 247 268 260 238 231 225 228 243 970 1073 1141 1182 1270 1322 1386 1455 1485 1593 1421 1345 1287 1367 1380 1445 1519 1555 1651 1751 1809 1820 1873 1848 1836 1760 1691 1642 1621 1651 828 214 911 1001 1117 1205 1333 1434 1512 1580 1640 249 290 320 380 418 482 537 599 685 American Indian/Native American 2 2 2 2 2 3 5 5 6 6 Asian Black Hispanic/Latino Native Hawaiian/Pacific Islander White Multi-race Unknown/Other 46 52 62 69 78 84 94 94 103 113 1146 1154 1180 1258 1298 1341 1432 1482 1518 1603 1712 1814 1926 2042 2152 2266 2372 2484 2625 2841 2 2 1 2 2 2 2 2 3 3 2321 2369 2407 2453 2511 2536 2570 2576 2611 2678 259 270 279 294 303 297 281 295 309 324 0 0 0 0 0 0 0 0 0 0 Mode of Transmission Groups MSM MSM/PWID Male PWID Female PWID Men who have sex with women Women who have sex with men Missing/Other Priority/Special Populations Hispanic/Latino MSM Black MSM White MSM Hispanic/Latino WSM Black WSM White WSM Hispanic/Latino MSW Black MSW White MSW Hispanic/Latino Transgender Women Black Transgender Women White Transgender Women Other Race Transgender Women Hispanic/Latino Transgender Men Black Transgender Men White Transgender Men Other Race Transgender Men 3659 3844 4020 4204 4380 4543 4708 4905 5108 5458 482 265 205 470 252 197 475 245 201 493 258 204 523 257 201 512 262 207 534 253 215 510 251 220 525 244 220 522 256 221 244 241 244 254 255 257 259 260 264 274 579 605 617 649 673 692 728 734 757 782 54 53 55 58 57 57 57 58 57 55 1172 1263 1363 1454 1555 1637 1726 1836 1952 2148 443 466 480 530 558 608 659 707 734 805 1808 1856 1895 1919 1945 1981 1995 2010 2036 2096 167 260 116 88 106 34 178 274 114 90 99 36 180 287 112 96 97 38 185 308 118 99 189 315 124 99 102 100 40 42 196 321 126 105 97 42 208 346 131 107 98 42 209 344 134 108 98 41 228 349 136 105 103 43 236 367 137 114 103 44 38 38 38 43 47 47 49 61 64 61 17 18 18 19 26 19 20 23 25 26 10 10 12 10 11 9 4 0 0 0 0 5 0 0 0 0 6 0 0 1 0 8 6 0 0 1 0 7 6 0 0 1 0 8 6 0 0 1 0 6 0 0 1 0 8 5 0 0 1 0 6 0 0 2 0 5 0 0 2 0 Missing/Other 1226 1216 1237 1289 1332 1336 1357 1353 1383 1414 Table 1. People Living With HIV by Specified Demographics in Austin, TGA from 2013-2022. Ann Robbins, Texas Department of State Health Services. 2023. 2021 Austin TGA 1,485 1,651 1,621 1,580 599 2022 Austin TGA 1593 1751 1651 1640 685 0% 10% 20% 30% 40% 50% 60% 70% 80% 90% 100% 0-12 13-24 25-34 35-44 45-54 55-64 65+ Figure 1. Comparison of 2021 and 2022 HIV Diagnosis data by age categories from Texas DSHS HIV/STI surveillance data. In 2021, Ann Robbins, HIV/STI Section of Texas DSHS reported that about 50% of diagnosed PLWH are between the ages of 35 and 54. In 2022, according to the provided surveillance data this statistic has dropped to about 45%. 2021 Austin TGA 1,518 2,625 2,611 309 2022 Austin TGA 1603 2841 2678 341 0% 10% 20% 30% 40% 50% 60% 70% 80% 90% 100% Asian Black Hispanic/Latino White Multi-race Figure 2. Comparison of 2021 and 2022 HIV Diagnosis data by race/ethnicity categories from Texas DSHS HIV/STI surveillance. Texas Department of State Health Services also provided a table of specified demographics for Newly Diagnosed PLWH only in the Austin TGA New Diagnosis by Specified Demographics in Austin TGA 2013 2014 2015 2016 2017 2018 2019 2020 2021 2022 337 338 301 295 262 311 289 255 218 276 Total Sex at birth Female Male Gender identity Transgender Women Transgender Men Cisgender Women Cisgender Men Additional Gender Identity Age at Diagnosis 0-14 15-24 25-34 35-44 45-54 55-64 65+ Race/Ethnicity American Indian/Native American Asian Black Hispanic/Latino Native Hawaiian/Pacific Islander White Multi-race Unknown/Other 38 28 36 35 34 38 38 22 33 35 238 273 302 276 255 224 217 196 262 302 4 0 3 0 5 1 5 0 6 0 1 0 2 0 6 1 6 1 9 0 38 28 35 35 34 38 38 21 32 35 234 270 297 271 249 223 215 190 256 291 0 0 0 0 0 0 0 0 0 2 106 134 117 114 102 101 101 125 152 1 48 99 65 46 12 5 0 6 1 78 53 44 17 2 0 5 0 79 59 51 13 2 1 8 0 72 64 31 22 5 0 3 0 76 46 32 17 4 0 6 0 90 14 0 1 58 53 27 16 5 0 5 0 7 0 0 57 56 23 12 6 1 7 0 78 4 0 0 50 38 23 4 2 0 3 0 51 12 0 0 54 69 29 15 3 0 6 0 73 8 0 0 66 66 27 21 5 0 8 0 83 10 0 49 48 55 57 61 49 50 42 57 67 109 124 151 132 118 100 115 110 151 169 0 0 1 1 100 110 106 102 101 12 0 14 0 16 0 16 0 Mode of Transmission Groups 208 233 263 239 218 190 184 173 224 268 102 122 104 119 135 19 23 23 17 23 5 6 6 31 1 88 23 78 6 20 5 3 2 1 2 1 1 0 0 0 0 0 8 4 9 23 1 29 85 8 12 1 3 4 2 1 1 1 0 0 0 0 0 7 6 9 30 0 31 85 8 17 2 6 2 1 3 1 0 1 0 0 1 0 6 8 13 27 0 40 78 9 9 7 5 4 3 4 1 0 0 0 0 0 0 6 4 9 30 0 93 38 66 10 12 6 3 3 3 2 4 0 0 0 0 0 0 12 10 9 13 28 1 78 33 72 11 8 7 3 5 3 1 0 0 0 0 0 0 0 21 5 5 6 33 0 95 27 51 9 15 8 3 3 0 0 1 1 0 0 0 0 0 10 10 4 4 18 0 93 35 29 8 3 4 3 1 1 4 2 0 0 0 0 1 0 20 9 5 8 28 0 40 50 12 10 3 5 3 1 4 1 1 0 0 0 1 0 14 11 6 8 30 0 48 62 11 13 5 6 1 1 5 4 0 0 0 0 0 0 MSM MSM/PWID Male PWID Female PWID Men who have sex with women Women who have sex with men Missing/Other Priority/Special Populations Hispanic/Latino MSM Black MSM White MSM Hispanic/Latino WSM Black WSM White WSM Hispanic/Latino MSW Black MSW White MSW Hispanic/Latino Transgender Women Black Transgender Women White Transgender Women Other Race Transgender Women Hispanic/Latino Transgender Men Black Transgender Men White Transgender Men Other Race Transgender Men Missing/Other 47 Table 2. New Diagnoses of HIV by Specified Demographics in Austin, TGA from 2013-2022. Ann Robbins, Texas Department of State Health Services. 2023. 46 42 58 47 46 41 51 37 53 Texas Department of State Health Services, Ann Robbins provided recommendations to disrupt transmission in the summer of 2023. When looking at the ~8,000 PLWH in 2019, 58% have achieved a suppressed viral load. The Figure below provides a breakdown of non-virally suppressed persons. Figure 3. Recommendations to Disrupt HIV Transmission using 2019 data. 2023. Ann Robins, Texas DSHS. There is a need to assist PLWH in achieving a suppressed viral load, as 42% of the ~8,000, or 2 out of every 5 persons are unable to attain viral suppression. When looking into those who are not able to achieve viral suppression, 17% of 3267 persons w/o viral suppression are living without a diagnosis and 13% have a diagnosis but are not in care. An analysis of 2019 Austin TGA data, combined with transmission likelihood rates from national Centers for Disease Control and Prevention (CDC) studies on the HIV Continuum, revealed that 80% of new HIV acquisitions (cases) in Austin TGA were associated with individuals who were either undiagnosed with HIV or diagnosed but not receiving care. Figure 4. Relationship between profile of PLWH who are not virally suppressed that is associated with new HIV acquisitions. In 2019, the proportion of PLWH who have a diagnosis was in the 80’s for most priority populations. MSMs, Males at Birth, Latinx persons, and those who are 13-24 years old had the lowest proportions of diagnosis overall. Figure 5. Rates of Diagnosis by Priority Population using 2019 data. Ann Robbins, Texas DSHS. 2023. Figure 6. Rates of Diagnosis by Key Demographics using 2019 data. Ann Robbins, Texas DSHS. 2023. 2022 Assessment of Service Needs and Barriers for those in and out of care The Needs Assessment Survey of 2022 aimed to provide an assessment of service needs and barriers for PLWH in the Austin TGA, including those who do not know their status, and those who know their status and are not in care. In the 2022 Needs Assessment survey for service needs and barriers, people were asked to record their needed services regardless of if they received it within 13 listed categories related to the RWHAP. Field (Out of Care) English % (n) 60.0 (160) 65.0 (36) Field Spanish % (n) Agency (In care) English % (n) 75.0 (60) Overall (total %/3) 67.0 52.0 (130) 62.0 (34) 70.0 (47) 61.0 45.0 (114) 60.0 (33) 67.0 (45) 58.0 HIV Medical Appointments /Medical Appointments/Citas Medicas Dental Care/Cuidado dental Free to low cost medications/ Medicinas gratis o a bajo costo Total Respondents 251 55 67 Table 3. The top three service categories based on highest percentage of Survey Respondents who indicated that they needed this service in the past 12 months regardless of whether it was received by Survey Used. The top three needs overall from all three survey sources were 1. Medical Appointments/HIV Medical Appointments, 2. Dental Care, and 3. Free-to-low-cost medications. The table above depicts the counts of Needs Assessment participants, by survey used, who indicated that this service was needed regardless of whether the service was received. The top three needs were the same reported needs the 2017 Needs assessment. The order of needs changed slightly with dental care moving up to the second highest needed service, and medication assistance moving to third. Needs assessment survey participants were later asked to select their 5 most needed services. The results of the selections are seen in Table 4. Field Spanish % (n) Field English % (n) 54.0 (134) 66.0 (38) Agency English % (n) 58.0 (39) Average 61.0 HIV Medical Appointments /Medical Appointments/Citas Medicas Dental Care/Cuidado dental Free to low cost medications/ Medicinas gratis o a bajo costo Food bank/banco aliemento Help with Housing/ayada para viviendo 57.0 (141) 66.0 (38) 61.0 (41) 46.0(115) 57.0 (33) 55.0 (35) 29.0 (72) 45.0 (26) 52.0 (35) 37.0 (93) 36.0 (21) 49.0 (33) 60.0 53.0 43.0 38.0 Table 4. Average top five percentages regarding to the question “Think about the most important services you currently need. Check the 5 services you need the most. (Select only 5)”. 2022 Overall, the order of service needs indicated by the 2022 survey participants are: o 1. HIV Medical Appointments/Medical Appointments o 2. Dental Care o 3. Free to low-cost medications o 4. Food bank o 5. Help with Housing The patterns of needs among the three survey locations are similar with slight differences in the top needed service of being either Dental Care or Medical Appointment. Participants of the Needs Assessment were asked to report their most common reasons for missing medications and appointments from a compiled list. There was also an option to write in additional barriers faced. For all participants in the field regardless of language spoken, the top three barriers faced are: 1. ability to pay for services 2. 3. Not knowing where to go lack of access to health insurance Figure 7, which focuses on the barriers faced for persons who are already be connected to care were unique in that “other” was the most selected barrier. The barriers discussed by agency (in-care) participants included: o Seeing [another doctor] o New diagnosis o None/didn’t have it/I didn’t know I was positive/I am HIV-negative/I do not have an HIV diagnosis. o Legal issues and housing Figure 7. Percentage of Agency responses for English Speakers to the question “If you did not see a doctor for your health or receive a medication, why not? Select all that apply”. Denominator 22. 2022 Pulled from Previous Minutes, in February 2023 and June 2023 HIVPC FASPNA decided: - - Topics that Council members would like more information on: childcare, dental care, transportation, education on resources (“I did not know where to go”), affordability, insurance education, access to lab work, PrEP and PEP education, housing, verbal abuse and harassment (online vs. in-person), data on Native American and Pacific Islander populations, data on trans community. Young Adult Latinx and Black MSM, Black WSM, Black MSW were priority populations.