2_Update on Lower Colorado River and Highland Lakes water supply conditions — original pdf
Backup
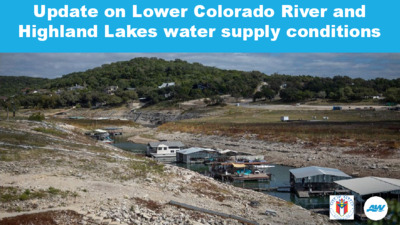
Update on Lower Colorado River and Highland Lakes water supply conditions Average 1942 - Present Average 2008 - 2015 2024 Jan.-May 2025 Highland Lakes Inflows Highland Lakes Inflows t e e F - e r c A 250,000 225,000 200,000 175,000 150,000 125,000 100,000 75,000 50,000 25,000 0 Jan Feb Mar Apr May Jun Jul Aug Sep Oct Nov Dec Lakes Buchanan & Travis Combined Storage Combined Storage of Lakes Buchanan and Travis January 1, 2005 through June 1, 2025 2.0M ac-ft Full Storage 1.4M ac-ft, DCP Stage 1 0.9M ac-ft, DCP Stage 2 0.75M ac-ft, DCP Stage 3 0.6M ac-ft, DCP Stage 4 t e e f - e r c a , e g a r o t S 2,200,000 2,000,000 1,800,000 1,600,000 1,400,000 1,200,000 1,000,000 800,000 600,000 400,000 200,000 0 2005 2006 2007 2008 2009 2010 2011 2012 2013 2014 2015 2016 2017 2018 2019 2020 2021 2022 2023 2024 2025 2026 U.S. Drought Monitor NOAA 3-month Outlook: July – Sep The seasonal outlooks combine long-term trends, soil moisture, and El Nino/Southern Oscillation. NOAA El Niño/Southern Oscillation Forecast ENSO-neutral is favored through the Northern Hemisphere through the Summer of 2025. 74% chance of ENSO- neutral in June-August 2025, chances exceeding 50% through August- October 2025. Lakes Buchanan & Travis Combined Storage Projections Questions?