Backup_2024.07.12 Combined Modeling Characterization Sheets — original pdf
Backup
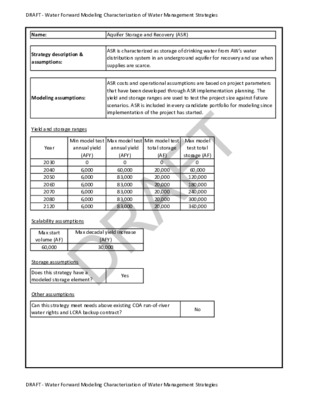
DRAFT ‐ Water Forward Modeling Characterization of Water Management Strategies Name: Aquifer Storage and Recovery (ASR) Strategy description & assumptions: ASR is characterized as storage of drinking water from AW's water distribution system in an underground aquifer for recovery and use when supplies are scarce. ASR costs and operational assumptions are based on project parameters that have been developed through ASR implementation planning. The yield and storage ranges are used to test the project size against future scenarios. ASR is included in every candidate portfolio for modeling since implementation of the project has started. Modeling assumptions: Yield and storage ranges Year 2030 2040 2050 2060 2070 2080 2120 Min model test annual yield (AFY) 0 6,000 6,000 6,000 6,000 6,000 6,000 Max model test annual yield (AFY) 0 60,000 83,000 83,000 83,000 83,000 83,000 Min model test total storage (AF) 0 20,000 20,000 20,000 20,000 20,000 20,000 Max model test total storage (AF) 0 60,000 120,000 180,000 240,000 300,000 360,000 Scalability assumptions Max start volume (AF) 60,000 Max decadal yield increase (AFY) 30,000 Storage assumptions Does this strategy have a modeled storage element? Other assumptions Yes Can this strategy meet needs above existing COA run‐of‐river water rights and LCRA backup contract? No DRAFT ‐ Water Forward Modeling Characterization of Water Management Strategies DRAFT DRAFT ‐ Water Forward Modeling Characterization of Water Management Strategies Cost Estimate Summary City of Austin ‐ S‐1 Aquifer Storage and Recovery (ASR) CAPITAL COST Item Estimated Cost For Facilities Primary Pump Station (74 MGD) Transmission Pipeline (66 in dia., approx. 50 miles) Well Fields (72 Wells, Pumps, and approx. 13 miles Well Field Piping) Storage Tanks (Other Than at Booster Pump Stations) Water Treatment Plant ‐ wellfield (37 MGD) Integration Point Infrastructure (10 MG GST, 74 MGD Pump Station, Yard Piping, etc) TOTAL COST OF FACILITIES Engineering and Feasibility Studies, Legal Assistance, Financing, Bond Counsel, and Contingencies (30% for pipes & 35% for all other facilities) Environmental & Archaeology Studies and Mitigation Land Acquisition/Leasing and Surveying Interest During Construction (3% for 5 years with a 0.5% ROI) x TOTAL COST OF PROJECT ANNUAL COST Debt Service (6 percent, 20 years) Operation and Maintenance Pipeline, Wells, and Storage Tanks (1% of Cost of Facilities) Intakes and Pump Stations (2.5% of Cost of Facilities) Water Treatment Plant Pumping Energy Costs (248,925,076 kW‐hr @ 0.08 $/kW‐hr) TOTAL ANNUAL COST Available Project Yield (acft/yr) Annual Cost of Water ($ per acft), based on PF= Annual Cost of Water After Debt Service ($ per acft), based on PF= Annual Cost of Water ($ per 1,000 gallons), based on PF= Annual Cost of Water After Debt Service ($ per 1,000 gallons), based on PF= $59,730,000 $520,192,000 $197,260,000 $86,020,000 $78,352,000 $941,554,000 $306,407,000 $11,881,000 $90,169,000 $176,797,000 $1,526,808,000 x x x $132,186,000 $7,390,000 $2,914,000 $4,343,000 $19,914,000 $166,747,000 83,232 $2,003 $415 $6.15 $1.27 Notes: 1) Costs have been calculated for maximum project yield in December 2023 dollars. 2) Costs are preliminary and subject to change based on optimization modeling and portfolio tradeoff analysis results. DRAFT ‐ Water Forward Modeling Characterization of Water Management Strategies DRAFT DRAFT ‐ Water Forward Modeling Characterization of Water Management Strategies Name: Brackish Groundwater Desalination Strategy description & assumptions: Brackish Groundwater Desalination is characterized as withdrawal and desalination of brackish (salty) groundwater for treatment to potable drinking water. Brackish Groundwater Desalination costs have been developed based on the 2120 max annual yield, and assume that reverse osmosis would be required to treat the water. The yield ranges below are provided to test project configuration and operations against future scenarios. When this strategy is included in a portfolio, it is modeled as being available with a constant yield. Modeling assumptions: Yield and storage ranges Year 2030 2040 2050 2060 2070 2080 2120 Min model test annual yield (AFY) 0 10,000 10,000 10,000 10,000 10,000 10,000 Max model test annual yield (AFY) 0 20,000 20,000 40,000 40,000 40,000 40,000 Min model test total storage (AF) N/A N/A N/A N/A N/A N/A N/A Max model test total storage (AF) N/A N/A N/A N/A N/A N/A N/A Scalability assumptions Max start volume (AF) 40,000 Max decadal yield increase (AFY) 20,000 Storage assumptions Does this strategy have a modeled storage element? No Other assumptions Can this strategy meet needs above existing COA run‐of‐river water rights and LCRA backup contract? Yes DRAFT ‐ Water Forward Modeling Characterization of Water Management Strategies DRAFT DRAFT ‐ Water Forward Modeling Characterization of Water Management Strategies Cost Estimate Summary City of Austin ‐ S‐2 Brackish Groundwater Desalination CAPITAL COST Item Transmission Pipeline (48 in dia., approx. 7 miles) Primary Pump Station (38 MGD) Pipeline Crossings Well Fields (Wells, Pumps, and Piping) Storage Tanks (Other Than at Booster Pump Stations) Water Treatment Plant (36 MGD) TOTAL COST OF FACILITIES Engineering and Feasibility Studies, Legal Assistance, Financing, Bond Counsel, and Contingencies (35% for pipes & 45% for all other facilities) Environmental & Archaeology Studies and Mitigation Land Acquisition and Surveying Interest During Construction (3% for 3 years with a 1.5% ROI) TOTAL COST OF PROJECT ANNUAL COST Debt Service (5 percent, 30 years) Operation and Maintenance Pipeline, Wells, and Storage Tanks (1% of Cost of Facilities) Intakes and Pump Stations (2.5% of Cost of Facilities) Water Treatment Plant Pumping Energy Costs (55766058 kW‐hr @ 0.1 $/kW‐hr) TOTAL ANNUAL COST Available Project Yield (acft/yr) Annual Cost of Water ($ per acft), based on PF=1 Annual Cost of Water After Debt Service ($ per acft), based on PF=1 Annual Cost of Water ($ per 1,000 gallons), based on PF=1 Annual Cost of Water After Debt Service ($ per 1,000 gallons), based on PF=1 Estimated Cost For Facilities $31,144,000 $11,480,000 $5,361,000 $88,779,000 $29,918,000 $262,721,000 $429,403,000 $189,581,000 $33,291,000 $66,650,000 $48,528,000 $767,453,000 $49,924,000 $1,862,000 $373,000 $45,326,000 $10,015,000 $107,500,000 40,000 $2,688 $1,439 $8.25 $4.42 Notes: 1) Costs have been calculated for maximum project yield in December 2023 dollars. 2) Costs are preliminary and subject to change based on optimization modeling and portfolio tradeoff analysis results. DRAFT ‐ Water Forward Modeling Characterization of Water Management Strategies DRAFT DRAFT ‐ Water Forward Modeling Characterization of Water Management Strategies Name: Indirect Potable Reuse (IPR) through Lady Bird Lake with local Inflows IPR through Lady Bird Lake is characterized by pumping highly‐treated reclaimed water from new side‐stream treatment facilities located near South Austin Regional wastewater treatment plant into Lady Bird Lake (LBL) in a drought emergency. Through a new intake pipe, water would be pulled from LBL into Ullrich water treatment plant and treated for potable use. The IPR strategy would only be used when Highland Lakes combined storage drops below 400,000 acre‐feet. Outside of drought emergencies, the intake and pumping components from IPR could be used to capture local spring inflows to LBL when available and the reclaimed transmission infrastructure can be used to support the centralized reclaimed water system. IPR project costs were developed based on preliminary engineering reports done for a 20 MGD IPR project. The yield ranges below are provided to test project configuration and operations against future scenarios. Strategy description & assumptions: Modeling assumptions: Yield and storage ranges Year 2030 2040 2050 2060 2070 2080 2120 Min model test annual yield (AFY) 0 22,400 22,400 22,400 22,400 22,400 22,400 Max model test annual yield (AFY) 0 22,400 22,400 44,800 44,800 44,800 44,800 Min model test total storage (AF) N/A N/A N/A N/A N/A N/A N/A Max model test total storage (AF) N/A N/A N/A N/A N/A N/A N/A Scalability assumptions Max start volume (AF) 22,400 Max decadal yield increase (AFY) 5,000 Storage assumptions Does this strategy have a modeled storage element? Other assumptions No Can this strategy meet needs above existing COA run‐of‐river water rights and LCRA backup contract? No DRAFT ‐ Water Forward Modeling Characterization of Water Management Strategies DRAFT DRAFT ‐ Water Forward Modeling Characterization of Water Management Strategies Cost Estimate Summary City of Austin ‐ S‐3 Indirect Potable Reuse through Lady Bird Lake with local Inflows CAPITAL COST Item Estimated Cost For Facilities Transmission Pipeline (36 in dia., approx. 1 miles) Intake Pump Station (21 MGD) From Lady Bird Lake to Ullrich WTP Transmission Pipeline (36 in dia., approx. 8 miles) Pump Station (18.8 MGD) From SAR WWTP to Lady Bird Lake Pipeline Crossings Additional Treatment (20 MGD) at the WWTP Prior to Pumping to Lady Bird Lake Dechlorination at the WWTP Outfall (20 MGD) TOTAL COST OF FACILITIES Engineering and Feasibility Studies, Legal Assistance, Financing, Bond Counsel, and Contingencies (35% for pipes & 45% for all other facilities) Environmental & Archaeology Studies and Mitigation Land Acquisition and Surveying Interest During Construction (3% for 3 years with a 1.5% ROI) TOTAL COST OF PROJECT ANNUAL COST Debt Service (5 percent, 30 years) Operation and Maintenance Pipeline, Wells, and Storage Tanks (1% of Cost of Facilities) Intakes and Pump Stations (2.5% of Cost of Facilities) Water Treatment Plant Pumping Energy Costs (14293230 kW‐hr @ 0.1 $/kW‐hr) TOTAL ANNUAL COST Available Project Yield (acft/yr) Annual Cost of Water ($ per acft), based on PF=1 Annual Cost of Water After Debt Service ($ per acft), based on PF=1 Annual Cost of Water ($ per 1,000 gallons), based on PF=1 Annual Cost of Water After Debt Service ($ per 1,000 gallons), based on PF=1 $2,773,000 $61,066,000 $33,444,000 $7,488,000 $4,961,000 $2,186,000 $2,186,000 $114,104,000 x $47,229,000 $2,499,000 $5,241,000 $11,413,000 $180,486,000 x x $11,741,000 $494,000 $2,228,000 $3,808,000 $1,439,000 $19,710,000 x x 22,400 $880 $356 $2.70 $1.09 Notes: 1) Costs have been calculated for maximum project yield in December 2023 dollars. 2) Costs are preliminary and subject to change based on optimization modeling and portfolio tradeoff analysis results. DRAFT ‐ Water Forward Modeling Characterization of Water Management Strategies DRAFT DRAFT ‐ Water Forward Modeling Characterization of Water Management Strategies Name: New Off Channel Reservoir, Colorado River water Strategy description & assumptions: This strategy is characterized as construction of a new off‐channel reservoir owned and operated by Austin Water and supplied with water from the Colorado River upstream of Austin's wastewater treatment plant outfalls. The new off‐channel reservoir is assumed to be filled when water is available in the Colorado River and treated at a new water treatment plant. The yield ranges below are provided to test project configuration and operations against various future scenarios. Modeling assumptions: Yield and storage ranges Year 2030 2040 2050 2060 2070 2080 2120 Min model test annual yield (AFY) 0 0 0 10,000 10,000 10,000 10,000 Max model test annual yield (AFY) 0 0 0 25,000 25,000 25,000 25,000 Min model test total storage (AF) 0 0 0 10,000 10,000 10,000 10,000 Max model test total storage (AF) 0 0 0 25,000 25,000 25,000 25,000 Scalability assumptions Max start volume (AF) N/A Max decadal yield increase (AFY) N/A Storage assumptions Does this strategy have a modeled storage element? Other assumptions Yes Can this strategy meet needs above existing COA run‐of‐river water rights and LCRA backup contract? No DRAFT ‐ Water Forward Modeling Characterization of Water Management Strategies DRAFT DRAFT ‐ Water Forward Modeling Characterization of Water Management Strategies Cost Estimate Summary City of Austin ‐ S‐4 New Off Channel Reservoir, Colorado River water CAPITAL COST Item Off‐Channel Storage/Ring Dike (Conservation Pool 25,000 acft) Transmission Pipeline (78 in dia., approx. 18 miles) Intake Pump Station (105 MGD) Transmission Pipeline (48 in dia., approx. 17 miles) Intake Pump Station (34 MGD) Pipeline Crossings Water Treatment Plant (23 MGD) Discharge Structure TOTAL COST OF FACILITIES Engineering and Feasibility Studies, Legal Assistance, Financing, Bond Counsel, and Contingencies (35% for pipes & 45% for all other facilities) Environmental & Archaeology Studies and Mitigation Land Acquisition and Surveying Interest During Construction (3% for 3 years with a 1.5% ROI) TOTAL COST OF PROJECT ANNUAL COST Debt Service (5 percent, 30 years) Reservoir Debt Service (5 percent, 30 years) Operation and Maintenance Pipeline, Wells, and Storage Tanks (1% of Cost of Facilities) Intakes and Pump Stations (2.5% of Cost of Facilities) Dam and Reservoir (1.5% of Cost of Facilities) Water Treatment Plant Pumping Energy Costs (17509523 kW‐hr @ 0.1 $/kW‐hr) TOTAL ANNUAL COST Estimated Cost For Facilities $38,743,000 $129,438,000 $123,016,000 $78,204,000 $56,729,000 $13,997,000 $103,239,000 $474,000 $543,840,000 $222,564,000 $184,759,000 $92,291,000 $70,434,000 $1,113,888,000 $51,176,000 $21,284,000 $2,665,000 $5,842,000 $755,000 $7,227,000 $5,173,000 $94,122,000 25,000 $3,765 $866 $11.55 $2.66 Available Project Yield (acft/yr) Annual Cost of Water ($ per acft), based on PF=1.5 Annual Cost of Water After Debt Service ($ per acft), based on PF=1.5 Annual Cost of Water ($ per 1,000 gallons), based on PF=1.5 Annual Cost of Water After Debt Service ($ per 1,000 gallons), based on PF=1.5 Notes: 1) Costs have been calculated for maximum project yield in December 2023 dollars. 2) Costs are preliminary and subject to change based on optimization modeling and portfolio tradeoff analysis results. DRAFT ‐ Water Forward Modeling Characterization of Water Management Strategies DRAFT DRAFT ‐ Water Forward Modeling Characterization of Water Management Strategies Name: New Off Channel Reservoir, Colorado River and reclaimed water Strategy description & assumptions: This strategy is characterized as construction of a new off‐channel reservoir owned and operated by Austin Water and supplied with water from the Colorado River downstream of Austin's wastewater treatment plant outfalls for augmented project yield. The new off‐channel reservoir is assumed to be filled when water is available in the Colorado River downstream of AW's wastewater treatment plant outfalls, providing an additional source of supply and reliability. The blended water in the Colorado River would be pumped into the OCR and stored for advanced treatment at a new water treatment plant. The yield ranges below are provided to test project configuration and operations against future scenarios. Modeling assumptions: Yield and storage ranges Year 2030 2040 2050 2060 2070 2080 2120 Min model test annual yield (AFY) 0 0 0 10,000 10,000 10,000 10,000 Max model test annual yield (AFY) 0 0 0 25,000 25,000 25,000 25,000 Min model test total storage (AF) 0 0 0 10,000 10,000 10,000 10,000 Max model test total storage (AF) 0 0 0 25,000 25,000 25,000 25,000 Scalability assumptions Max start volume (AF) N/A Max decadal yield increase (AFY) N/A Storage assumptions Does this strategy have a modeled storage element? Other assumptions Yes Can this strategy meet needs above existing COA run‐of‐river water rights and LCRA backup contract? No DRAFT ‐ Water Forward Modeling Characterization of Water Management Strategies DRAFT DRAFT ‐ Water Forward Modeling Characterization of Water Management Strategies Cost Estimate Summary City of Austin ‐ S‐5 New Off Channel Reservoir, Colorado River and reclaimed water CAPITAL COST Item Off‐Channel Storage/Ring Dike (Conservation Pool 25,000 acft) Transmission Pipeline (78 in dia., approx 13 miles) Intake Pump Station (105 MGD) Transmission Pipeline (48 in dia., approx 17 miles) Intake Pump Station (34 MGD) Pipeline Crossings Water Treatment Plant (23 MGD) Discharge Structure TOTAL COST OF FACILITIES Advanced Water Treatment Components (22.3 MGD) at New WTP Engineering and Feasibility Studies, Legal Assistance, Financing, Bond Counsel, and Contingencies (35% for pipes & 45% for all other facilities) Environmental & Archaeology Studies and Mitigation Land Acquisition and Surveying Interest During Construction (3% for 3 years with a 1.5% ROI) TOTAL COST OF PROJECT ANNUAL COST Debt Service (5 percent, 30 years) Reservoir Debt Service (5 percent, 50 years) Operation and Maintenance Pipeline, Wells, and Storage Tanks (1% of Cost of Facilities) Intakes and Pump Stations (2.5% of Cost of Facilities) Dam and Reservoir (1.5% of Cost of Facilities) Water Treatment Plant Advanced Water Treatment Components Pumping Energy Costs (17136203 kW‐hr @ 0.1 $/kW‐hr) TOTAL ANNUAL COST Estimated Cost For Facilities $38,743,000 $97,375,000 $121,504,000 $143,178,000 $56,729,000 $12,935,000 $103,239,000 $106,466,000 $474,000 $680,643,000 $280,941,000 $186,828,000 $90,648,000 $83,637,000 $1,322,697,000 $64,759,000 $21,284,000 $3,048,000 $5,793,000 $755,000 $7,227,000 $9,985,000 $5,074,000 $117,925,000 25,000 $4,717 $1,275 $14.47 $3.91 Available Project Yield (acft/yr) Annual Cost of Water ($ per acft), based on PF=1.5 Annual Cost of Water After Debt Service ($ per acft), based on PF=1.5 Annual Cost of Water ($ per 1,000 gallons), based on PF=1.5 Annual Cost of Water After Debt Service ($ per 1,000 gallons), based on PF=1.5 Notes: 1) Costs have been calculated for maximum project yield in December 2023 dollars. 2) Costs are preliminary and subject to change based on optimization modeling and portfolio tradeoff analysis results. DRAFT ‐ Water Forward Modeling Characterization of Water Management Strategies DRAFT DRAFT ‐ Water Forward Modeling Characterization of Water Management Strategies Name: Off‐channel storage supplied by Colorado River water (Decker Lake) Strategy description & assumptions: This strategy would utilize a portion of Decker Lake's existing capacity for off‐channel storage that would be supplied by Colorado River water via the existing intake location. Decker lake would be filled when water is available in the Colorado River at the current intake location and maintained between a 2.5‐5 foot operating range. Water from this strategy would be treated for potable use via a new water treatment plant with advanced treatment. The yield ranges below are provided to test project configuration and operations against various future scenarios. Modeling assumptions: Yield and storage ranges Year 2030 2040 2050 2060 2070 2080 2120 Min model test annual yield (AFY) 0 9,600 9,600 9,600 9,600 9,600 9,600 Max model test annual yield (AFY) 0 18,300 18,300 18,300 18,300 18,300 18,300 Min model test total storage (AF) 0 3,200 3,200 3,200 3,200 3,200 3,200 Max model test total storage (AF) 0 6,100 6,100 6,100 6,100 6,100 6,100 Scalability assumptions Max start volume (AF) N/A Max decadal yield increase (AFY) N/A Storage assumptions Does this strategy have a modeled storage element? Other assumptions Yes Can this strategy meet needs above existing COA run‐of‐river water rights and LCRA backup contract? No DRAFT ‐ Water Forward Modeling Characterization of Water Management Strategies DRAFT DRAFT ‐ Water Forward Modeling Characterization of Water Management Strategies Cost Estimate Summary City of Austin ‐ S‐6 Off‐channel reservoir supplied by Colorado River water (Decker Lake) CAPITAL COST Item Transmission Pipeline (78 in dia., approx. 2 miles) Intake Pump Station (105 MGD) Pipeline Crossings Transmission Pipeline (36 in dia., approx. 1 mile) Intake Pump Station (17 MGD) Water Treatment Plant (16 MGD) Advanced Water Treatment Components (16.3 MGD) at New WTP TOTAL COST OF FACILITIES Engineering and Feasibility Studies, Legal Assistance, Financing, Bond Counsel, and Contingencies (35% for pipes & 45% for all other facilities) Environmental & Archaeology Studies and Mitigation Land Acquisition and Surveying Interest During Construction (3% for 3 years with a 1.5% ROI) TOTAL COST OF PROJECT ANNUAL COST Debt Service (5 percent, 30 years) Operation and Maintenance Pipeline, Wells, and Storage Tanks (1% of Cost of Facilities) Intakes and Pump Stations (2.5% of Cost of Facilities) Water Treatment Plant Advanced Water Treamtent Components Pumping Energy Costs (5342404 kW‐hr @ 0.1 $/kW‐hr) TOTAL ANNUAL COST Available Project Yield (acft/yr) Annual Cost of Water ($ per acft), based on PF=1 Annual Cost of Water After Debt Service ($ per acft), based on PF=1 Annual Cost of Water ($ per 1,000 gallons), based on PF=1 Annual Cost of Water After Debt Service ($ per 1,000 gallons), based on PF=1 Estimated Cost For Facilities $22,880,000 $103,676,000 $1,859,000 $2,923,000 $45,886,000 $76,485,000 $77,925,000 $331,634,000 $146,469,000 $4,855,000 $2,397,000 $32,762,000 $518,117,000 $33,704,000 $332,000 $4,861,000 $5,354,000 $7,449,000 $3,807,000 $55,507,000 18,300 $3,033 $1,191 $9.31 $3.66 Notes: 1) Costs have been calculated for maximum project yield in December 2023 dollars. 2) Costs are preliminary and subject to change based on optimization modeling and portfolio tradeoff analysis results. DRAFT ‐ Water Forward Modeling Characterization of Water Management Strategies DRAFT DRAFT ‐ Water Forward Modeling Characterization of Water Management Strategies Name: Additional Supply from LCRA, regional Colorado River partnerships, and/or water rights optimization Strategy description & assumptions: For the purposes of WF24 modeling, this strategy is characterized as additional supply from the Lower Colorado River Authority through a new or amended contract. Additional water from LCRA would be subject to the same pro‐rata curtailment as AW's primary contracted water. The yield ranges below are provided to test project configuration and operations against various future scenarios. Modeling assumptions: Yield and storage ranges Year 2030 2040 2050 2060 2070 2080 2120 Min model test annual yield (AFY) 0 5,000 5,000 5,000 5,000 5,000 5,000 Max model test annual yield (AFY) 0 30,000 30,000 30,000 30,000 30,000 30,000 Min model test total storage (AF) N/A N/A N/A N/A N/A N/A N/A Max model test total storage (AF) N/A N/A N/A N/A N/A N/A N/A Scalability assumptions Max start volume (AF) 30,000 Max decadal yield increase (AFY) 25,000 Storage assumptions Does this strategy have a modeled storage element? Other assumptions No Can this strategy meet needs above existing COA run‐of‐river water rights and LCRA backup contract? Yes DRAFT ‐ Water Forward Modeling Characterization of Water Management Strategies DRAFT DRAFT ‐ Water Forward Modeling Characterization of Water Management Strategies Cost Estimate Summary City of Austin ‐ S‐7 Additional Water Supplies from LCRA CAPITAL COST Item TOTAL COST OF FACILITIES TOTAL COST OF PROJECT ANNUAL COST Debt Service (5 percent, 30 years) Operation and Maintenance Pipeline, Wells, and Storage Tanks (1% of Cost of Facilities) Intakes and Pump Stations (2.5% of Cost of Facilities) Dam and Reservoir (1.5% of Cost of Facilities) Water Treatment Plant Advanced Water Treatment Facility Pumping Energy Costs (0 kW‐hr @ 0.1 $/kW‐hr) Purchase of Water (30000 acft/yr @ $155/acft) TOTAL ANNUAL COST Available Project Yield (acft/yr) Annual Cost of Water ($ per acft), based on PF=1 Annual Cost of Water After Debt Service ($ per acft), based on PF=1 Annual Cost of Water ($ per 1,000 gallons), based on PF=1 Annual Cost of Water After Debt Service ($ per 1,000 gallons), based on PF=1 Estimated Cost For Facilities $0 $0 $0 $0 $0 $0 $0 $4,057,000 $0 $0 $9,750,000 $13,807,000 30,000 $460 $460 $1.41 $1.41 Notes: 1) Costs have been calculated for maximum project yield in December 2023 dollars. 2) Costs are preliminary and subject to change based on optimization modeling and portfolio tradeoff analysis results. DRAFT ‐ Water Forward Modeling Characterization of Water Management Strategies DRAFT DRAFT ‐ Water Forward Modeling Characterization of Water Management Strategies Name: Seawater Desalination Strategy description & assumptions: Seawater desalination is characterized as sourcing water from the Gulf of Mexico and treating it via a desalination plant on the coast. Dissolved solids are removed by forcing the source water through membranes at high pressure. As characterized, this strategy would be owned and operated by Austin Water, but there may be opportunities to implement this strategy through a regional partnership approach. The seawater desalination plant cost estimate is based on a new advanced treatment facility and transmission infrastructure between the Gulf of Mexico and Austin. The yield ranges below are provided to test project configuration and operations against future scenarios. When this strategy is included in a portfolio, it is modeled as being available with a constant yield. Modeling assumptions: Yield and storage ranges Year 2030 2040 2050 2060 2070 2080 2120 Min model test annual yield (AFY) 0 0 0 40,000 40,000 40,000 40,000 Max model test annual yield (AFY) 0 0 0 60,000 60,000 60,000 60,000 Min model test total storage (AF) N/A N/A N/A N/A N/A N/A N/A Max model test total storage (AF) N/A N/A N/A N/A N/A N/A N/A Scalability assumptions Max start volume (AF) 60,000 Max decadal yield increase (AFY) N/A Storage assumptions Does this strategy have a modeled storage element? No Other assumptions Can this strategy meet needs above existing COA run‐of‐river water rights and LCRA backup contract? Yes DRAFT ‐ Water Forward Modeling Characterization of Water Management Strategies DRAFT DRAFT ‐ Water Forward Modeling Characterization of Water Management Strategies Cost Estimate Summary City of Austin ‐ S‐8 Seawater Desalination CAPITAL COST Item Transmission Pipeline (72 in dia., 250 miles) Intake Pump Station (94 MGD) Transmission Pump Station(s) & Storage Tank(s) Pipeline Crossings Storage Tanks (Other Than at Booster Pump Stations) Water Treatment Plant (75 MGD) Concentrate Disposal Outfall in Gulf TOTAL COST OF FACILITIES Engineering and Feasibility Studies, Legal Assistance, Financing, Bond Counsel, and Contingencies (35% for pipes & 45% for all other facilities) Environmental & Archaeology Studies and Mitigation Land Acquisition and Surveying Interest During Construction (3% for 3 years with a 1.5% ROI) TOTAL COST OF PROJECT ANNUAL COST Debt Service (5 percent, 30 years) Operation and Maintenance Pipeline, Wells, and Storage Tanks (1% of Cost of Facilities) Intakes and Pump Stations (2.5% of Cost of Facilities) Water Treatment Plant Pumping Energy Costs (180598532 kW‐hr @ 0.1 $/kW‐hr) TOTAL ANNUAL COST Available Project Yield (acft/yr) Annual Cost of Water ($ per acft), based on PF=1 Annual Cost of Water After Debt Service ($ per acft), based on PF=1 Annual Cost of Water ($ per 1,000 gallons), based on PF=1 Annual Cost of Water After Debt Service ($ per 1,000 gallons), based on PF=1 Notes: 1) Costs have been calculated for maximum project yield in December 2023 dollars. 2) Costs are preliminary and subject to change based on optimization modeling and portfolio tradeoff analysis results. DRAFT ‐ Water Forward Modeling Characterization of Water Management Strategies Estimated Cost For Facilities $1,105,283,000 $135,220,000 $138,645,000 $126,982,000 $48,238,000 $809,868,000 $80,987,000 $2,445,223,000 $977,124,000 $68,148,000 $137,596,000 $244,897,000 $3,872,988,000 $251,943,000 $16,550,000 $8,326,000 $121,480,000 $18,060,000 $416,359,000 84,000 $4,957 $1,957 $15.21 $6.01 DRAFT DRAFT ‐ Water Forward Modeling Characterization of Water Management Strategies Name: Direct Potable Reuse (DPR) from Wastewater Treatment Plant Strategy description & assumptions: DPR is characterized as using new advanced treatment (similar to desalination treatment) facilities to purify highly‐treated reclaimed water to potable levels to supplement drinking water supply. Direct potable reuse costs are estimated based on treatment with reverse osmosis and include costs for deep‐well injection for disposal of RO concentrate. The yield ranges below are provided to test project configuration and operations against various future scenarios. When this strategy is included in a portfolio, it is modeled as being available with a constant yield. Modeling assumptions: Yield and storage ranges Year 2030 2040 2050 2060 2070 2080 2120 Min model test annual yield (AFY) 0 5,000 5,000 5,000 5,000 5,000 5,000 Max model test annual yield (AFY) 0 11,200 11,200 22,400 22,400 22,400 22,400 Min model test total storage (AF) N/A N/A N/A N/A N/A N/A N/A Max model test total storage (AF) N/A N/A N/A N/A N/A N/A N/A Scalability assumptions Max start volume (AF) 11,200 Max decadal yield increase (AFY) N/A Storage assumptions Does this strategy have a modeled storage element? No Other assumptions Can this strategy meet needs above existing COA run‐of‐river water rights and LCRA backup contract? Yes DRAFT ‐ Water Forward Modeling Characterization of Water Management Strategies DRAFT DRAFT ‐ Water Forward Modeling Characterization of Water Management Strategies Cost Estimate Summary City of Austin ‐ S‐9 Direct Potable Reuse from Wastewater Treatment Plant CAPITAL COST Item Transmission Pipeline (36 in dia., approx. 15 miles) Primary Pump Station (21 MGD) from SAR WWTP to ATF/WTP Transmission Pipeline (18 in dia., 9 miles) Primary Pump Station (5.3 MGD) for Conentrate Disposal Pipeline Crossings Well Fields (Wells, Pumps, and Piping) Storage Tanks (Other Than at Booster Pump Stations) Water Treatment Plant (20 MGD) Advanced Water Treatment Components (30 MGD) TOTAL COST OF FACILITIES Engineering and Feasibility Studies, Legal Assistance, Financing, Bond Counsel, and Contingencies (35% for pipes & 45% for all other facilities) Environmental & Archaeology Studies and Mitigation Land Acquisition and Surveying Interest During Construction (3% for 3 years with a 1.5% ROI) TOTAL COST OF PROJECT ANNUAL COST Debt Service (5 percent, 30 years) Operation and Maintenance Pipeline, Wells, and Storage Tanks (1% of Cost of Facilities) Intakes and Pump Stations (2.5% of Cost of Facilities) Water Treatment Plant Advanced Water Treatment Components Pumping Energy Costs (15094858 kW‐hr @ 0.1 $/kW‐hr) TOTAL ANNUAL COST Available Project Yield (acft/yr) Annual Cost of Water ($ per acft), based on PF=1.5 Annual Cost of Water After Debt Service ($ per acft), based on PF=1.5 Annual Cost of Water ($ per 1,000 gallons), based on PF=1.5 Annual Cost of Water After Debt Service ($ per 1,000 gallons), based on PF=1.5 Notes: 1) Costs have been calculated for maximum project yield in December 2023 dollars. 2) Costs are preliminary and subject to change based on optimization modeling and portfolio tradeoff analysis results. DRAFT ‐ Water Forward Modeling Characterization of Water Management Strategies Estimated Cost For Facilities $59,640,000 $17,819,000 $12,139,000 $6,306,000 $10,472,000 $12,260,000 $29,291,000 $91,260,000 $220,901,000 $460,088,000 $198,814,000 $57,389,000 $13,199,000 $49,241,000 $778,731,000 $50,657,000 $1,486,000 $784,000 $6,388,000 $25,739,000 $1,708,000 $86,762,000 22,400 $3,873 $1,612 $11.88 $4.95 DRAFT DRAFT ‐ Water Forward Modeling Characterization of Water Management Strategies Name: Interbasin Transfer of Surface Water Strategy description & assumptions: No specific project opportunity has been identified for the interbasin transfer strategy. For the purposes of Water Forward, this strategy is characterized as a surface water transfer via new intake, transmission, and treatment infrastructure from a neighboring river basin. The costs for an interbasin transfer include intake, conveyance, purchase, and additional treatment O&M costs. The yield ranges below are provided to test project configuration and operations against various future scenarios. Yields are modeled as subject to drought restrictions based on Highland Lakes storage. Modeling assumptions: Yield and storage ranges Year 2030 2040 2050 2060 2070 2080 2120 Min model test annual yield (AFY) 0 0 0 0 0 0 0 Max model test annual yield (AFY) 0 0 0 0 20,000 20,000 20,000 Min model test total storage (AF) N/A N/A N/A N/A N/A N/A N/A Max model test total storage (AF) N/A N/A N/A N/A N/A N/A N/A Scalability assumptions Max start volume (AF) 20,000 Max decadal yield increase (AFY) 20,000 Storage assumptions Does this strategy have a modeled storage element? No Other assumptions Can this strategy meet needs above existing COA run‐of‐river water rights and LCRA backup contract? Yes DRAFT ‐ Water Forward Modeling Characterization of Water Management Strategies DRAFT DRAFT ‐ Water Forward Modeling Characterization of Water Management Strategies Cost Estimate Summary City of Austin ‐ S‐10 Interbasin Transfer (surface water) CAPITAL COST Item Transmission Pipeline (36 in dia., 60 miles) Intake Pump Stations (26.8 MGD) Transmission Pump Station(s) & Storage Tank(s) Pipeline Crossings Water Treatment Plant (17.9 MGD) TOTAL COST OF FACILITIES Engineering and Feasibility Studies, Legal Assistance, Financing, Bond Counsel, and Contingencies (35% for pipes & 45% for all other facilities) Environmental & Archaeology Studies and Mitigation Land Acquisition and Surveying Interest During Construction (3% for 3 years with a 1.5% ROI) TOTAL COST OF PROJECT ANNUAL COST Debt Service (5 percent, 30 years) Reservoir Debt Service (5 percent, 30 years) Operation and Maintenance Pipeline, Wells, and Storage Tanks (1% of Cost of Facilities) Intakes and Pump Stations (2.5% of Cost of Facilities) Water Treatment Plant Purchase of Water (20000 acft/yr @ 93.5 $/acft) TOTAL ANNUAL COST Available Project Yield (acft/yr) Annual Cost of Water ($ per acft), based on PF=1.5 Annual Cost of Water After Debt Service ($ per acft), based on PF=1.5 Annual Cost of Water ($ per 1,000 gallons), based on PF=1.5 Annual Cost of Water After Debt Service ($ per 1,000 gallons), based on PF=1.5 Notes: 1) Costs have been calculated for maximum project yield in December 2023 dollars. 2) Costs are preliminary and subject to change based on optimization modeling and portfolio tradeoff analysis results. Estimated Cost For Facilities $196,553,000 $61,220,000 $20,496,000 $10,067,000 $45,990,000 $334,326,000 x $129,784,000 $4,185,000 $24,121,000 $33,239,000 $525,655,000 x x $34,195,000 $0 $2,509,000 $2,576,000 $3,219,000 $1,870,000 $45,839,000 x 20,000 $2,292 $582 $7.03 $1.79 DRAFT ‐ Water Forward Modeling Characterization of Water Management Strategies DRAFT DRAFT ‐ Water Forward Modeling Characterization of Water Management Strategies Name: Importation of conventional groundwater No specific project opportunity has been identified for the conventional groundwater importation strategy. For the purposes of Water Forward, this strategy is characterized as acquisition of groundwater permits through the requisite Groundwater Conservation District(s) and development of wellfields, transmission, treatment, and disposal infrastructure owned by Austin Water. Costs for conventional groundwater are based on the 2120 max annual yield. The yield ranges below are provided to test project configuration and operations against various future scenarios. When this strategy is included in a portfolio, it is modeled as being available with a constant yield. Strategy description & assumptions: Modeling assumptions: Yield and storage ranges Year 2030 2040 2050 2060 2070 2080 2120 Min model test annual yield (AFY) 0 5,000 5,000 5,000 5,000 5,000 5,000 Max model test annual yield (AFY) 0 20,000 20,000 20,000 20,000 20,000 20,000 Min model test total storage (AF) N/A N/A N/A N/A N/A N/A N/A Max model test total storage (AF) N/A N/A N/A N/A N/A N/A N/A Scalability assumptions Max start volume (AF) 20,000 Max decadal yield increase (AFY) 10,000 Storage assumptions Does this strategy have a modeled storage element? No Other assumptions Can this strategy meet needs above existing COA run‐of‐river water rights and LCRA backup contract? Yes DRAFT ‐ Water Forward Modeling Characterization of Water Management Strategies DRAFT DRAFT ‐ Water Forward Modeling Characterization of Water Management Strategies Cost Estimate Summary City of Austin ‐ S‐11 Importation of conventional groundwater CAPITAL COST Item Estimated Cost For Facilities Transmission Pipeline (36 in dia., approx. 57 miles) Primary Pump Station (19 MGD) Transmission Pump Station(s) & Storage Tank(s) Pipeline Crossings Well Fields (Wells, Pumps, and Piping) Storage Tanks (Other Than at Booster Pump Stations) Chlorine Disinfection and Filtration for New Groundwater Supply (18 MGD) TOTAL COST OF FACILITIES Engineering and Feasibility Studies, Legal Assistance, Financing, Bond Counsel, and Contingencies (35% for pipes & 45% for all other facilities) Environmental & Archaeology Studies and Mitigation Required Land Acquisition and Surveying by the Groundwater Conser. District Interest During Construction (3% for 3 years with a 1.5% ROI) TOTAL COST OF PROJECT ANNUAL COST Debt Service (5 percent, 30 years) Operation and Maintenance Pipeline, Wells, and Storage Tanks (1% of Cost of Facilities) Intakes and Pump Stations (2.5% of Cost of Facilities) Groundwater Treatment ‐ Chlorine Disinfection and Filtration Pumping Energy Costs (40071630 kW‐hr @ 0.1 $/kW‐hr) TOTAL ANNUAL COST Available Project Yield (acft/yr) Annual Cost of Water ($ per acft), based on PF=1 Annual Cost of Water After Debt Service ($ per acft), based on PF=1 Annual Cost of Water ($ per 1,000 gallons), based on PF=1 Annual Cost of Water After Debt Service ($ per 1,000 gallons), based on PF=1 $166,750,000 $11,913,000 $13,949,000 $9,047,000 $38,711,000 $12,389,000 $8,053,000 $260,812,000 $99,785,000 $7,108,000 $548,304,000 $61,831,000 $977,840,000 $63,610,000 $2,747,000 $774,000 $2,657,000 $4,007,000 $73,795,000 20,000 $3,690 $509 $11.32 $1.56 Notes: 1) Costs have been calculated for maximum project yield in December 2023 dollars. 2) Costs are preliminary and subject to change based on optimization modeling and portfolio tradeoff analysis results. DRAFT ‐ Water Forward Modeling Characterization of Water Management Strategies DRAFT DRAFT ‐ Water Forward Modeling Characterization of Water Management Strategies Name: Utility‐Side Water Loss Reduction Strategy description: Utility‐Side Water Loss Reduction is a strategy to decrease water loss in the Austin Water distribution system. Current AW programs to address water loss include investments in customer meter accuracy and meter replacement, repair and replacement of waters mains throughout the system, and integration of AMI data into water loss practices. This WF24 strategy would include additional new programs such as improvements to production meters, expanded active leak detection programs, and additional analysis of new data. Modeling assumptions: Yield is based on projected water use and reflects reduction of Austin Water's Infrastructure Leak Index (ILI) to 3.0 in 2040 to 2.0 in 2120. Yield ranges for Demand Reduction (DR) Pathways Year 2030 2040 2050 2060 2070 2080 2120 DR1 yield (AFY) 2,800 7,500 9,400 11,300 13,200 15,000 26,300 DR2 yield (AFY) 2,800 7,500 9,400 11,300 13,200 15,000 26,300 DR3 yield (AFY) 2,800 7,500 9,400 11,300 13,200 15,000 26,300 DR4 yield (AFY) 2,800 7,500 9,400 11,300 13,200 15,000 26,300 DR5 yield (AFY) 2,800 7,500 9,400 11,300 13,200 15,000 26,300 DR6 yield (AFY) 2,800 7,500 9,400 11,300 13,200 15,000 26,300 DR7 yield (AFY) 2,800 7,500 9,400 11,300 13,200 15,000 26,300 Scalability assumptions Max start volume (AF) Max decadal yield increase (AFY) 2,800 4,700 Storage assumptions Does this strategy have a modeled storage element? No Other assumptions Can this strategy meet needs above existing COA run‐of‐river water rights and LCRA backup contract? Yes DRAFT ‐ Water Forward Modeling Characterization of Water Management Strategies DRAFT DRAFT ‐ Water Forward Modeling Characterization of Water Management Strategies Cost Estimate Summary City of Austin - D-12 Utility-Side Water Loss Control Item Estimated Costs for Facilities CAPITAL COST Replacement Production Meters TOTAL COST OF FACILITIES Engineering and Feasibility Studies, Legal Assistance, Financing, Bond Counsel, and Contingencies (35% for pipes & 45% for all other facilities) Interest During Construction (3% for 3 years with a 1.5% ROI) TOTAL COST OF PROJECT ANNUAL COST Debt Service (5 percent, 30 years) Reservoir Debt Service (5 percent, 30 years) Operation and Maintenance Meter O&M Active Leak Detection O&M Water Treatment Plant Advanced Water Treamtent Facility Pumping Energy Costs (0 kW-hr @ 0.1 $/kW-hr) Purchase of Water ( acft/yr @ $/acft) TOTAL ANNUAL COST Available Project Yield (acft/yr) Annual Cost of Water ($ per acft), based on PF=0 Annual Cost of Water After Debt Service ($ per acft), based on PF=0 Annual Cost of Water ($ per 1,000 gallons), based on PF=0 Annual Cost of Water After Debt Service ($ per 1,000 gallons), based on PF=0 x x x x $45,000,000 $45,000,000 $20,250,000 $4,405,000 $69,655,000 $4,531,000 $500,000 $2,000,000 $0 $0 $0 $0 $0 $7,031,000 x 26,300 $267 $95 $0.82 $0.29 Notes: 1) Costs have been calculated for maximum project yield in December 2023 dollars. 2) Costs are preliminary and subject to change based on optimization modeling and portfolio tradeoff analysis results. DRAFT ‐ Water Forward Modeling Characterization of Water Management Strategies DRAFT DRAFT ‐ Water Forward Modeling Characterization of Water Management Strategies Name: Customer Side Water Use Management Strategy description: Austin Water's existing customer‐side water use management efforts include requiring new site plans to submit water benchmarking applications, implementation of MyATX Water advanced metering infrastructure, and many customer‐facing rebates and incentives. This WF24 strategy includes expanded customer incentives for conservation, use of benchmarking and MyATX Water data to create water use budgets for customers and to expand identification of customer‐side water leaks, and savings from customer behavior changes based on real‐time water use data. Modeling assumptions: Yield is based on total actual water use and is dependent on the level of implementation of other demand reduction strategies included in the demand reduction (DR) pathways. Yield ranges for Demand Reduction (DR) Pathways Year 2030 2040 2050 2060 2070 2080 2120 DR1 yield (AFY) 200 1,100 2,000 2,800 3,700 4,500 6,700 DR2 yield (AFY) 200 1,100 2,000 2,800 3,700 4,500 6,700 DR3 yield (AFY) 200 1,100 2,000 2,800 3,600 4,400 6,600 DR4 yield (AFY) 200 1,100 2,000 2,800 3,600 4,400 6,600 DR5 yield (AFY) 200 2,100 3,800 5,500 7,200 8,800 13,200 DR6 yield (AFY) 200 2,100 3,800 5,500 7,200 8,800 13,300 DR7 yield (AFY) 200 2,100 3,800 5,500 7,200 8,800 13,100 Scalability assumptions Max start volume (AF) Max decadal yield increase (AFY) 200 1,900 Storage assumptions Does this strategy have a modeled storage element? No Other assumptions Can this strategy meet needs above existing COA run‐of‐river water rights and LCRA backup contract? Yes DRAFT ‐ Water Forward Modeling Characterization of Water Management Strategies DRAFT DRAFT ‐ Water Forward Modeling Characterization of Water Management Strategies Cost Estimate Summary City of Austin - D-13 Customer-Side Water Use Management Item Estimated Costs for Facilities CAPITAL COST Potential Report/Application Development Other Facilities - Vehicles for program support TOTAL COST OF FACILITIES TOTAL COST OF PROJECT ANNUAL COST Debt Service (5 percent, 30 years) Operation and Maintenance Staffing Costs (6 employees at $100,000/yr) Vehicle Maintenance (2.5 vehicles with 20-yr lifetime) Customer Water Use Management Education TOTAL ANNUAL COST Available Project Yield (acft/yr) Annual Cost of Water ($ per acft), based on PF=0 Annual Cost of Water After Debt Service ($ per acft), based on PF=0 Annual Cost of Water ($ per 1,000 gallons), based on PF=0 Annual Cost of Water After Debt Service ($ per 1,000 gallons), based on PF=0 Notes: 1) Costs have been calculated for maximum project yield in December 2023 dollars. 2) Costs are preliminary and subject to change based on optimization modeling and portfolio tradeoff analysis results. $250,000 $75,000 $325,000 $325,000 $21,000 $600,000 $10,000 $50,000 $681,000 x x x x x 13,100 $52 $50 $0.16 $0.15 DRAFT ‐ Water Forward Modeling Characterization of Water Management Strategies DRAFT DRAFT ‐ Water Forward Modeling Characterization of Water Management Strategies Name: Native and Efficient Landscapes Strategy description: Austin Water currently has rebate and incentive programs to help customers transition to native and efficient landscapes. This WF24 strategy includes additional expanded efforts including new landscape transformation ordinances/incentives, irrigation efficiency incentives, and other strategies to promote conversion to native and efficient landscapes. Modeling assumptions: Yield is based on total actual water use and is dependent on the level of implementation of other demand reduction strategies included in the demand reduction (DR) pathways. Yield ranges for Demand Reduction (DR) Pathways Year 2030 2040 2050 2060 2070 2080 2120 DR1 yield (AFY) 300 900 1,500 2,000 2,600 3,100 5,600 DR2 yield (AFY) 300 900 1,500 2,000 2,600 3,100 5,600 DR3 yield (AFY) 300 900 1,500 2,000 2,500 3,000 5,500 DR4 yield (AFY) 300 900 1,500 2,000 2,600 3,100 5,500 DR5 yield (AFY) 600 1,800 2,900 4,000 5,100 6,100 10,900 DR6 yield (AFY) 600 1,800 2,900 4,000 5,100 6,100 11,000 600 1,800 2,900 3,900 5,000 6,000 10,900 DR7 yield (AFY) Scalability assumptions Max start volume (AF) Max decadal yield increase (AFY) 600 1,200 Storage assumptions Does this strategy have a modeled storage element? No Other assumptions Can this strategy meet needs above existing COA run‐of‐river water rights and LCRA backup contract? Yes DRAFT ‐ Water Forward Modeling Characterization of Water Management Strategies DRAFT DRAFT ‐ Water Forward Modeling Characterization of Water Management Strategies Cost Estimate Summary City of Austin - D-14 Native and Efficient Landscapes Item Estimated Costs for Facilities CAPITAL COST Other Facilities - Vehicles for Program Support TOTAL COST OF FACILITIES Cost to Convert to Native Landscaping (4600 acres) TOTAL COST OF PROJECT ANNUAL COST Land Conversion Debt Service Operation and Maintenance Staffing Costs (2 employees at $100,000/yr) Vehicle Maintenance (2.5 vehicles with 20-yr lifetime) TOTAL ANNUAL COST Available Project Yield (acft/yr) Annual Cost of Water ($ per acft), based on PF=0 Annual Cost of Water After Debt Service ($ per acft), based on PF=0 Annual Cost of Water ($ per 1,000 gallons), based on PF=0 Annual Cost of Water After Debt Service ($ per 1,000 gallons), based on PF=0 Notes: 1) Costs have been calculated for maximum project yield in December 2023 dollars. 2) Costs are preliminary and subject to change based on optimization modeling and portfolio tradeoff analysis results. 3) One or more cost element has been calculated externally $75,000 $75,000 $832,740,000 $832,815,000 $55,516,000 $200,000 $10,000 $55,726,000 x x x x x 10,900 $5,112 $511 $15.69 $0.06 DRAFT ‐ Water Forward Modeling Characterization of Water Management Strategies DRAFT DRAFT ‐ Water Forward Modeling Characterization of Water Management Strategies Name: Centralized Reclaimed Strategy description: Austin's centralized reclaimed water system, or "purple pipe" system, currently provides highly‐treated wastewater effluent for non‐potable uses such as irrigation, cooling, manufacturing, and toilet flushing to customers. This WF24 strategy represents expansion existing centralized reclaimed water use, including codes and incentives to require or encourage connection to the centralized reclaimed water system. Modeling assumptions: Modeling of the centralized reclaimed pathways includes modeling of the existing reclaimed ordinance (DR1), an expanded network of reclaimed water pipes (DR2 and DR3), a larger connection area ordinance requirement (DR4 and DR5), or both an expanded pipe network and ordinance requirement (DR6 and DR7). Yield ranges for Demand Reduction (DR) Pathways Year 2030 2040 2050 2060 2070 2080 2120 DR1 yield (AFY) 1,100 7,200 10,600 14,000 17,400 20,800 32,200 DR2 yield (AFY) 1,100 7,300 10,900 14,500 18,100 21,600 33,700 DR3 yield (AFY) 1,100 7,300 10,900 14,500 18,100 21,600 33,600 DR4 yield (AFY) 1,100 8,100 12,700 17,300 21,900 26,400 40,900 DR5 yield (AFY) 1,100 8,100 12,700 17,200 21,800 26,300 40,800 DR6 yield (AFY) 1,100 8,200 12,900 17,600 22,300 26,900 41,700 DR7 yield (AFY) 1,100 8,200 12,900 17,600 22,300 26,900 41,700 Scalability assumptions Max start volume (AF) Max decadal yield increase (AFY) 1,100 7,100 Storage assumptions Does this strategy have a modeled storage element? No Other assumptions Can this strategy meet needs above existing COA run‐of‐river water rights and LCRA backup contract? Yes DRAFT ‐ Water Forward Modeling Characterization of Water Management Strategies DRAFT DRAFT ‐ Water Forward Modeling Characterization of Water Management Strategies Cost Estimate Summary City of Austin - D-15 Centralized Reclaimed Item Estimated Costs for Facilities CAPITAL COST Conveyance TOTAL COST OF FACILITIES Engineering and Feasibility Studies, Legal Assistance, Financing, Bond Counsel, and Contingencies (35% for pipes & 45% for all other facilities) Cost to Customer for Reuse Connection (Including Dual Plumbing, Yard Line, and Connection) Interest During Construction (3% for 3 years with a 1.5% ROI) TOTAL COST OF PROJECT ANNUAL COST Debt Service (5 percent, 30 years) Operation and Maintenance Pipeline, Wells, and Storage Tanks (1% of Cost of Facilities) TOTAL ANNUAL COST Available Project Yield (acft/yr) Annual Cost of Water ($ per acft), based on PF=0 Annual Cost of Water After Debt Service ($ per acft), based on PF=0 Annual Cost of Water ($ per 1,000 gallons), based on PF=0 Annual Cost of Water After Debt Service ($ per 1,000 gallons), based on PF=0 x x x x x $899,162,000 $899,162,000 $314,707,000 $104,202,000 $88,970,000 $1,407,041,000 $91,530,000 $2,000,000 $93,530,000 41,700 $2,243 $48 $6.88 $0.15 Notes: 1) Costs have been calculated for maximum project yield in December 2023 dollars. 2) Costs are preliminary and subject to change based on optimization modeling and portfolio tradeoff analysis results. 3) One or more cost element has been calculated externally DRAFT ‐ Water Forward Modeling Characterization of Water Management Strategies DRAFT DRAFT ‐ Water Forward Modeling Characterization of Water Management Strategies Name: Decentralized Reclaimed Strategy description: This strategy was included as "Distributed Wastewater Reuse" in the Council‐ approved Water Forward 2018 Plan. Decentralized Reclaimed is defined for WF24 as the collection of wastewater from sewer systems separate from the Austin's centralized wastewater system, treatment of that wastewater, and reuse at the local/community scale. These facilities would be completely separate from the centralized wastewater collection system. Reuse of the treated water via a dual (purple) pipe system would supply irrigation, landscaping, toilet, laundry (clothes washing), and cooling demands. Modeling assumptions: Modeling of the decentralized reclaimed pathways includes modeling of yield based on our existing decentralized wastewater systems (DR1, DR2, DR3, DR4, DR5, and DR6 ) and yield based on addition of new decentralized wastewater systems to Austin Water's management (DR7). Yield ranges for Demand Reduction (DR) Pathways Year 2030 2040 2050 2060 2070 2080 2120 DR1 yield (AFY) 0 100 300 400 500 600 1,300 DR2 yield (AFY) 0 100 300 400 500 600 1,300 DR3 yield (AFY) 0 100 300 400 500 600 1,300 DR4 yield (AFY) 0 100 300 400 500 600 1,300 DR5 yield (AFY) 0 100 300 400 500 600 1,300 DR6 yield (AFY) 0 100 300 400 500 600 1,300 0 200 500 800 1,100 1,300 3,100 DR7 yield (AFY) Scalability assumptions Max start volume (AF) Max decadal yield increase (AFY) 0 200 Storage assumptions Does this strategy have a modeled storage element? No Other assumptions Can this strategy meet needs above existing COA run‐of‐river water rights and LCRA backup contract? Yes DRAFT ‐ Water Forward Modeling Characterization of Water Management Strategies DRAFT DRAFT ‐ Water Forward Modeling Characterization of Water Management Strategies Cost Estimate Summary City of Austin - D-16 Decentralized Reclaimed Item Estimated Costs for Facilities CAPITAL COST Treatment Facilities ($50/gpd cost factor) TOTAL COST OF FACILITIES Cost to Customer for Reuse Connection (Including Dual Plumbing, Yard Line, and Connection) Interest During Construction (3% for 3 years with a 1.5% ROI) TOTAL COST OF PROJECT ANNUAL COST Debt Service (5 percent, 30 years) Operation and Maintenance Pipeline, Wells, and Storage Tanks (1% of Cost of Facilities) TOTAL ANNUAL COST Available Project Yield (acft/yr) Annual Cost of Water ($ per acft), based on PF=0 Annual Cost of Water After Debt Service ($ per acft), based on PF=0 Annual Cost of Water ($ per 1,000 gallons), based on PF=0 Annual Cost of Water After Debt Service ($ per 1,000 gallons), based on PF=0 $138,375,000 $138,375,000 $7,746,000 $13,600,000 $215,071,000 $13,991,000 $2,000,000 $15,991,000 x x x x x 3,100 $5,158 $645 $15.83 $1.98 Notes: 1) Costs have been calculated for maximum project yield in December 2023 dollars. 2) Costs are preliminary and subject to change based on optimization modeling and portfolio tradeoff analysis results. 3) One or more cost element has been calculated externally DRAFT ‐ Water Forward Modeling Characterization of Water Management Strategies DRAFT DRAFT ‐ Water Forward Modeling Characterization of Water Management Strategies Name: Onsite Reuse Strategy description: Austin currently has ordinances requiring onsite reuse of rainwater and AC condensate for new developments over 250,000 sqft. The WF24 strategy includes implementation of these existing ordinances as well as future phases of onsite reuse implementation. Onsite reuse water can be sourced from rainwater, stormwater, AC condensate, graywater, or black water. AC condensate and rainwater were used as a representative case for characterization. Modeling assumptions: Modeling of the onsite reuse pathways includes modeling of the existing onsite reuse ordinance (DR1 and DR2), adjusting the ordinance to have a smaller building size threshold requirement (DR2 and DR4), increasing required benchmarks for onsite reuse (DR3 and DR5), and both the adjusted ordinance and increased benchmarks (DR6 and DR7). Yield ranges for Demand Reduction (DR) Pathways Year 2030 2040 2050 2060 2070 2080 2120 DR1 yield (AFY) 1,100 3,100 4,800 6,500 8,200 9,800 15,300 DR2 yield (AFY) 1,100 3,200 4,800 6,400 8,000 9,600 15,000 DR3 yield (AFY) 1,100 4,500 6,900 9,300 11,700 14,100 22,100 DR4 yield (AFY) 1,100 2,800 4,000 5,200 6,400 7,600 11,900 DR5 yield (AFY) 1,100 3,900 5,700 7,500 9,300 11,000 17,400 DR6 yield (AFY) 1,100 2,700 3,900 5,000 6,200 7,300 11,600 DR7 yield (AFY) 1,100 4,000 5,700 7,300 9,000 10,600 16,300 Scalability assumptions Max start volume (AF) Max decadal yield increase (AFY) 1,100 3,400 Storage assumptions Does this strategy have a modeled storage element? No Other assumptions Can this strategy meet needs above existing COA run‐of‐river water rights and LCRA backup contract? Yes DRAFT ‐ Water Forward Modeling Characterization of Water Management Strategies DRAFT DRAFT ‐ Water Forward Modeling Characterization of Water Management Strategies Cost Estimate Summary City of Austin - D-17 Onsite Reuse Item Estimated Costs for Facilities CAPITAL COST Storage - Reuse Harvesting Cistern Storage (409 MG) TOTAL COST OF FACILITIES Engineering and Feasibility Studies, Legal Assistance, Financing, Bond Counsel, and Contingencies (35% for pipes & 45% for all other facilities) Cost to Customer for Reuse Connection (Including Dual Plumbing, Yard Line, and Connection) Interest During Construction (3% for 3 years with a 1.5% ROI) TOTAL COST OF PROJECT COA Incentives from 2030 to 2120 TOTAL COST OF PROJECT (excluding COA incentives) ANNUAL COST Debt Service (5 percent, 20 years) Annual staffing costs (4 FTEs at $100k) Costomer O&M Cost (8% of capital cost) Annual COA incentive costs Pumping Energy Costs (0 kW-hr @ 0.1 $/kW-hr) Purchase of Water ( acft/yr @ $/acft) TOTAL ANNUAL COST Available Project Yield (acft/yr) Annual Cost of Water ($ per acft), based on PF=0 Annual Cost of Water After Debt Service ($ per acft), based on PF=0 Annual Cost of Water ($ per 1,000 gallons), based on PF=0 Annual Cost of Water After Debt Service ($ per 1,000 gallons), based on PF=0 Notes: 1) Costs have been calculated for maximum project yield in December 2023 dollars. 2) Costs are preliminary and subject to change based on optimization modeling and portfolio tradeoff analysis results. 3) One or more cost element has been calculated externally $841,418,000 $841,418,000 x $8,414,000 $40,682,000 $60,110,000 $950,624,000 $180,000,000 $770,624,000 $76,281,000 $400,000 $67,313,000 $2,000,000 $0 $0 $145,994,000 16,300 $8,957 $4,277 $27.48 $13.12 DRAFT ‐ Water Forward Modeling Characterization of Water Management Strategies DRAFT