20260211-002 Financial Report — original pdf
Backup
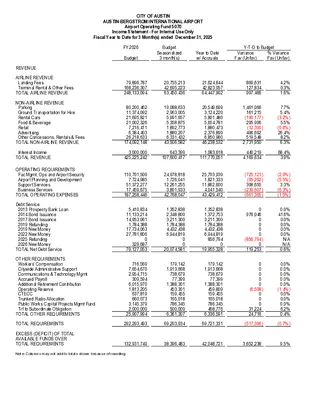
CITY OF AUSTIN AUSTIN-BERGSTROM INTERNATIONAL AIRPORT Airport Operating Fund 5070 Income Statement - For Internal Use Only Fiscal Year to Date for 3 Month(s) ended December 31, 2025 0 6 (1) REVENUE AIRLINE REVENUE Landing Fees Terminal Rental & Other Fees TOTAL AIRLINE REVENUE NON-AIRLINE REVENUE Parking Ground Transportation for Hire Rental Cars Food & Beverage Retail Advertising Other Concessions, Rentals & Fees TOTAL NON-AIRLINE REVENUE Interest Income TOTAL REVENUE OPERATING REQUIREMENTS Fac Mgmt, Ops and Airport Security Airport Planning and Development Support Services Business Services TOTAL OPERATING EXPENSES Debt Service 2013 Prosperity Bank Loan 2014 Bond Issuance 2017 Bond Issuance 2019 Refunding 2019 New Money 2022 New Money 2025 Refunding 2026 New Money TOTAL Net Debt Service OTHER REQUIREMENTS Workers' Compensation Citywide Administrative Support Communications & Technology Mgmt Accrued Payroll Additional Retirement Contribution Operating Reserve CTECC Trunked Radio Allocation Public Works Capital Projects Mgmt Fund Trf to Subordinate Obligation TOTAL OTHER REQUIREMENTS FY 2026 Budget Budget Seasonalized 3 month(s) Year to Date w/ Accruals Variance Fav (Unfav) % Variance Fav (Unfav) Y-T-D to Budget 79,896,787 168,236,307 248,133,094 80,200,462 11,374,092 21,695,821 21,002,326 7,216,411 6,384,403 26,218,633 174,092,148 3,000,000 425,225,242 110,701,509 7,724,985 51,372,277 17,459,675 187,258,446 5,410,834 11,133,214 14,953,061 1,784,388 17,734,063 27,781,806 0 329,687 79,127,053 716,569 7,654,670 2,954,715 309,594 6,015,970 1,813,205 637,819 660,073 3,145,379 2,000,000 25,907,994 20,755,213 42,695,223 63,450,436 19,088,633 2,963,005 5,991,657 5,358,875 1,892,773 1,880,207 6,331,432 43,506,582 21,624,844 42,823,057 64,447,902 20,549,699 3,124,220 5,801,480 5,654,781 1,880,473 2,376,899 6,850,980 46,238,532 643,399 107,600,417 1,083,618 111,770,051 24,978,818 1,726,041 12,261,255 3,801,933 42,768,047 1,352,838 2,348,800 3,211,300 1,784,388 4,432,438 6,944,819 0 0 20,074,581 179,142 1,913,668 738,679 77,399 1,388,301 453,301 159,455 165,018 786,345 500,000 6,361,307 25,703,939 1,821,333 11,862,600 4,041,540 43,429,412 1,352,838 1,372,753 3,211,300 1,784,388 4,432,438 6,944,819 856,794 0 19,955,328 179,142 1,913,668 738,679 77,399 1,388,301 459,809 159,455 165,018 786,345 468,776 6,336,591 869,631 127,834 997,466 1,461,066 161,215 (190,177) 295,906 (12,300) 496,692 519,548 2,731,950 440,219 4,169,634 (725,121) (95,292) 398,655 (239,607) (661,365) 0 976,046 0 0 0 0 (856,794) 0 119,253 0 0 0 0 0 (6,508) 0 0 0 31,224 24,716 4.2% 0.3% 1.6% 7.7% 5.4% (3.2%) 5.5% (0.6%) 26.4% 8.2% 6.3% 68.4% 3.9% (2.9%) (5.5%) 3.3% (6.3%) (1.5%) 0.0% 41.6% 0.0% 0.0% 0.0% 0.0% N/A N/A 0.6% 0.0% 0.0% 0.0% 0.0% 0.0% (1.4%) 0.0% 0.0% 0.0% 6.2% 0.4% TOTAL REQUIREMENTS 292,293,493 69,203,934 69,721,331 (517,396) (0.7%) EXCESS (DEFICIT) OF TOTAL AVAILABLE FUNDS OVER TOTAL REQUIREMENTS 132,931,749 38,396,483 42,048,721 3,652,238 9.5% Note: Columns may not add to totals shown because of rounding CITY OF AUSTIN AUSTIN-BERGSTROM INTERNATIONAL AIRPORT INCOME STATEMENT COMPARISON THIS YEAR VS. LAST YEAR This month - This Year vs. Last Year FY26 (Dec 25) vs FY25 (Dec 24) Fiscal YTD - This Year vs. Last Year FY26 (Oct 25 - Dec 25) vs FY25 (Oct 24 - Dec 24) FY26 Dec-25 FY25 Dec-24 Fav (Unfav) $ Variance Fav (Unfav) % Variance 7,145,282 14,744,688 21,889,970 5,128,530 9,666,717 14,795,247 2,016,751 5,077,971 7,094,722 6,477,552 953,772 1,601,407 1,757,470 529,551 703,399 2,273,906 14,297,056 6,221,598 909,236 1,612,317 1,699,449 535,051 426,113 2,196,561 13,600,324 255,954 44,536 (10,910) 58,022 (5,500) 277,286 77,345 696,732 282,932 36,469,957 292,142 28,687,714 (9,211) 7,782,244 9,772,668 715,443 4,578,608 1,378,812 16,445,531 7,700,872 553,127 3,558,425 1,402,347 13,214,770 450,889 0 1,304,640 0 1,477,958 2,315,221 856,794 6,405,501 59,714 637,889 246,226 25,800 462,767 153,270 53,152 55,006 262,115 184,793 2,140,731 451,003 589,820 497,723 1,189,604 1,477,000 2,282,470 0 6,487,620 55,312 596,158 235,932 19,857 416,298 331,870 52,810 48,719 248,252 0 2,005,207 (2,071,796) (162,317) (1,020,182) 23,535 (3,230,760) 115 589,820 (806,917) 1,189,604 (958) (32,751) (856,794) 82,118 (4,403) (41,731) (10,294) (5,942) (46,469) 178,600 (342) (6,287) (13,863) (184,793) (135,524) 39.3% 52.5% 48.0% 4.1% 4.9% (0.7%) 3.4% (1.0%) 65.1% 3.5% 5.1% (3.2%) 27.1% (26.9%) (29.3%) (28.7%) 1.7% (24.4%) 0.0% 100.0% (162.1%) 100.0% (0.1%) (1.4%) N/A 1.3% (8.0%) (7.0%) (4.4%) (29.9%) (11.2%) 53.8% (0.6%) (12.9%) (5.6%) N/A (6.8%) FY26 YTD Dec-25 21,624,844 42,823,057 64,447,902 20,549,699 3,124,220 5,801,480 5,654,781 1,880,473 2,376,899 6,850,980 46,238,532 1,083,618 111,770,051 25,703,939 1,821,333 11,862,600 4,041,540 43,429,412 1,352,838 1,372,753 3,211,300 1,784,388 4,432,438 6,944,819 856,794 19,955,328 179,142 1,913,668 738,679 77,399 1,388,301 459,809 159,455 165,018 786,345 468,776 6,336,591 FY25 YTD Dec-24 Fav (Unfav) $ Variance Fav (Unfav) % Variance 15,626,039 28,307,169 43,933,208 18,752,394 2,927,676 5,785,324 5,147,915 1,810,778 1,913,954 6,602,681 42,940,722 1,122,540 87,996,470 23,260,213 1,745,201 10,405,291 3,970,152 39,380,857 1,353,511 1,769,461 499,010 3,578,913 4,431,156 5,976,784 0 17,608,835 165,935 1,788,474 707,796 59,571 1,248,895 995,609 158,429 146,156 744,756 0 6,015,621 5,998,805 14,515,888 20,514,693 1,797,306 196,544 16,156 506,867 69,696 462,945 248,299 3,297,810 (38,922) 23,773,582 (2,443,726) (76,132) (1,457,309) (71,388) (4,048,555) 673 396,708 (2,712,289) 1,794,526 (1,281) (968,035) (856,794) (2,346,493) (13,208) (125,193) (30,883) (17,827) (139,406) 535,800 (1,026) (18,862) (41,589) (468,776) (320,970) 38.4% 51.3% 46.7% 9.6% 6.7% 0.3% 9.8% 3.8% 24.2% 3.8% 7.7% (3.5%) 27.0% (10.5%) (4.4%) (14.0%) (1.8%) (10.3%) 0.0% 22.4% (543.5%) 50.1% (0.0%) (16.2%) N/A (13.3%) (8.0%) (7.0%) (4.4%) (29.9%) (11.2%) 53.8% (0.6%) (12.9%) (5.6%) N/A (5.3%) Airline Revenue Landing Fees Terminal Rental & Other Fees Total Airline Revenue Non-Airline Revenue Parking Ground Transportation for Hire Rental Cars Food & Beverage Retail Advertising Other Concessions, Rentals & Fees Total Non-Airline Revenue Interest Income Total Operating Revenue Operating Requirements Fac Mgmt, Ops and Airport Security Airport Planning and Development Support Services Business Services Total Operating Expense Debt Service 2013 Prosperity Bank Loan 2014 Bond Issuance 2017 Bond Issuance 2019 Refunding 2019 New Money 2022 New Money 2025 Refunding Total Debt Service Other Requirements Workers' Compensation Citywide Administrative Support Communications & Technology Mgmt Accrued Payroll Additional Retirement Contribution Operating Reserve CTECC Trunked Radio Allocation Public Works Capital Projects Mgmt Fund Trf to Subordinate Obligation Total Other Requirements Total Requirements 24,991,763 21,707,597 (3,284,166) (15.1%) 69,721,331 63,005,313 (6,716,018) (10.7%) SURPLUS (DEFICIT) OF TOTAL AVAILABLE FUNDS OVER TOTAL REQUIREMENTS Note: Columns may not add to totals shown because of rounding 11,478,194 6,980,116 4,498,078 64.4% 42,048,721 24,991,157 17,057,564 68.3%