20250611-002 Fiancial Report — original pdf
Backup
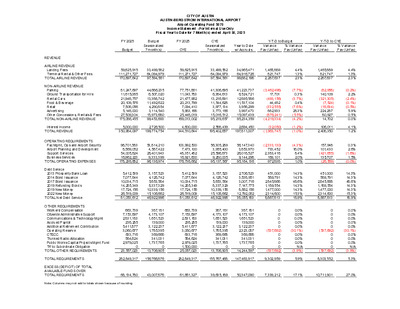
CITY OF AUSTIN AUSTIN-BERGSTROM INTERNATIONAL AIRPORT Airport Operating Fund 5070 Income Statement - For Internal Use Only Fiscal Year to Date for 7 Month(s) ended April 30, 2025 FY 2025 Budget Budget Seasonalized 7 month(s) FY 2025 CYE CYE Seasonalized 7 month(s) Y-T-D to Budget Y-T-D to CYE Year to Date w/ Accruals Variance Fav (Unfav) % Variance Fav (Unfav) Variance Fav (Unfav) % Variance Fav (Unfav) 1 15 REVENUE AIRLINE REVENUE Landing Fees Terminal Rental & Other Fees TOTAL AIRLINE REVENUE NON-AIRLINE REVENUE Parking Ground Transportation for Hire Rental Cars Food & Beverage Retail Advertising Other Concessions, Rentals & Fees TOTAL NON-AIRLINE REVENUE 59,625,915 111,271,727 170,897,642 33,499,582 64,094,979 97,594,561 59,625,915 111,271,727 170,897,642 33,499,582 64,094,979 97,594,561 34,965,471 64,916,726 99,882,198 1,465,889 821,747 2,287,637 81,247,697 11,615,065 21,948,757 20,109,576 7,508,056 5,148,000 27,509,304 175,086,455 44,686,235 6,507,020 13,388,742 11,492,622 4,290,854 3,114,540 15,973,680 99,453,693 77,751,861 11,043,783 21,477,962 20,213,799 7,094,410 5,983,168 25,448,019 169,013,002 41,306,695 6,384,613 13,216,891 11,544,628 3,977,134 3,773,186 15,016,512 95,219,657 41,223,737 6,524,721 12,895,586 11,537,104 3,958,299 3,997,473 15,097,439 95,234,359 (3,462,498) 17,701 (493,156) 44,482 (332,555) 882,933 (876,241) (4,219,334) Interest Income TOTAL REVENUE 5,000,000 350,984,097 2,726,500 199,774,754 4,600,000 344,510,644 2,588,439 195,402,657 2,694,450 197,811,007 (32,050) (1,963,747) OPERATING REQUIREMENTS Fac Mgmt, Ops and Airport Security Airport Planning and Development Support Services Business Services TOTAL OPERATING EXPENSES Debt Service 2013 Prosperity Bank Loan 2014 Bond Issuance 2017 Bond Issuance 2019 Refunding Bonds 2019 New Money 2022 New Money TOTAL Net Debt Service OTHER REQUIREMENTS Workers' Compensation Citywide Administrative Support Communications & Technology Mgmt Accrued Payroll Additional Retirement Contribution Operating Reserve CTECC Trunked Radio Allocation Public Works Capital Projects Mgmt Fund Trf to Subordinate Obligation TOTAL OTHER REQUIREMENTS 98,701,583 8,569,052 54,005,824 16,962,223 178,238,682 5,412,539 7,077,844 10,034,715 14,285,349 17,724,156 26,519,009 81,053,612 663,739 7,153,897 2,831,183 238,285 5,411,877 3,060,677 633,716 584,624 2,979,025 0 23,557,023 53,814,210 4,587,422 28,401,943 9,333,399 96,136,974 3,157,523 4,128,742 5,853,584 8,337,329 10,339,156 15,106,662 46,922,996 387,181 4,173,107 1,651,523 139,000 3,122,237 1,785,395 369,668 341,031 1,737,765 0 13,706,905 103,992,500 7,473,100 48,351,482 16,921,600 176,738,682 5,412,539 7,077,844 10,034,715 14,285,349 17,724,156 26,519,009 81,053,612 663,739 7,153,897 2,831,183 238,285 5,411,877 3,060,677 633,716 584,624 2,979,025 1,500,000 25,057,023 56,305,289 3,955,400 25,596,873 9,280,005 95,137,567 3,157,523 4,128,742 5,853,584 8,337,329 10,339,156 15,106,662 46,922,996 387,181 4,173,107 1,651,523 139,000 3,122,237 1,785,395 369,668 341,031 1,737,765 0 13,706,905 56,147,340 3,853,970 26,018,527 9,144,298 95,164,136 2,706,523 3,538,951 3,007,716 7,147,775 8,862,156 12,792,062 38,055,183 387,181 4,173,107 1,651,523 139,000 3,122,237 2,323,087 369,668 341,031 1,737,765 0 14,244,597 (2,333,130) 733,452 2,383,416 189,101 972,838 451,000 589,791 2,845,868 1,189,554 1,477,000 2,314,600 8,867,813 0 0 0 0 0 (537,692) 0 0 0 0 (537,692) 4.4% 1.3% 2.3% (7.7%) 0.3% (3.7%) 0.4% (7.8%) 28.3% (5.5%) (4.2%) (1.2%) (1.0%) (4.3%) 16.0% 8.4% 2.0% 1.0% 14.3% 14.3% 48.6% 14.3% 14.3% 15.3% 18.9% 0.0% 0.0% 0.0% 0.0% 0.0% (30.1%) 0.0% 0.0% 0.0% N/A (3.9%) 1,465,889 821,747 2,287,637 (82,958) 140,109 (321,305) (7,524) (18,834) 224,287 80,927 14,702 106,011 2,408,350 157,948 101,430 (421,655) 135,707 (26,569) 451,000 589,791 2,845,868 1,189,554 1,477,000 2,314,600 8,867,813 0 0 0 0 0 (537,692) 0 0 0 0 (537,692) 4.4% 1.3% 2.3% (0.2%) 2.2% (2.4%) (0.1%) (0.5%) 5.9% 0.5% 0.0% 4.1% 1.2% 0.3% 2.6% (1.6%) 1.5% (0.0%) 14.3% 14.3% 48.6% 14.3% 14.3% 15.3% 18.9% 0.0% 0.0% 0.0% 0.0% 0.0% (30.1%) 0.0% 0.0% 0.0% N/A (3.9%) TOTAL REQUIREMENTS 282,849,317 156,766,876 282,849,317 155,767,468 147,463,917 9,302,959 5.9% 8,303,552 5.3% EXCESS (DEFICIT) OF TOTAL AVAILABLE FUNDS OVER TOTAL REQUIREMENTS 68,134,780 43,007,878 61,661,327 39,635,189 50,347,090 7,339,212 17.1% 10,711,901 27.0% Note: Columns may not add to totals shown because of rounding CITY OF AUSTIN AUSTIN-BERGSTROM INTERNATIONAL AIRPORT INCOME STATEMENT COMPARISON THIS YEAR VS. LAST YEAR This month - This Year vs. Last Year Fiscal YTD - This Year vs. Last Year FY25 (Apr 25) vs FY24 (Apr 24) FY25 (Oct 24 - Apr 25) vs FY24 (Oct 23 - Apr 24) FY25 Apr-25 FY24 Apr-24 Fav (Unfav) $ Variance Fav (Unfav) % Variance FY25 YTD Apr-25 FY24 YTD Apr-24 Fav (Unfav) $ Variance Fav (Unfav) % Variance 5,331,977 9,395,581 14,727,559 4,384,451 7,860,183 12,244,634 947,527 1,535,398 2,482,925 5,735,083 977,514 2,071,545 1,683,767 586,962 525,422 2,037,176 13,617,469 5,755,747 980,249 2,633,026 1,762,721 631,548 400,108 1,960,966 14,124,365 (20,664) (2,736) (561,481) (78,955) (44,586) 125,315 76,210 (506,896) 462,939 28,807,967 527,310 26,896,310 (64,371) 1,911,657 7,636,253 568,032 3,918,696 1,251,054 13,374,036 6,986,820 440,923 3,093,479 1,288,434 11,809,655 (649,434) (127,109) (825,218) 37,380 (1,564,381) 3 29 27 50 0 (32,131) (32,021) 55,312 596,158 235,932 19,857 416,298 331,870 52,810 48,719 248,252 2,005,207 451,338 589,820 836,226 1,196,330 1,477,104 561,589 5,112,407 51,658 554,544 179,559 16,837 290,286 393,263 43,978 38,123 105,726 1,673,974 451,334 589,791 836,199 1,196,280 1,477,104 593,719 5,144,429 (3,653) (41,614) (56,373) (3,020) (126,012) 61,394 (8,832) (10,596) (142,526) (331,232) 21.6% 19.5% 20.3% (0.4%) (0.3%) (21.3%) (4.5%) (7.1%) 31.3% 3.9% (3.6%) (12.2%) 7.1% (9.3%) (28.8%) (26.7%) 2.9% (13.2%) 100.0% 100.0% 100.0% 100.0% 100.0% 105.7% 100.6% (7.1%) (7.5%) (31.4%) (17.9%) (43.4%) 15.6% (20.1%) (27.8%) (134.8%) (19.8%) 34,965,471 64,916,726 99,882,198 29,939,362 54,433,500 84,372,862 5,026,110 10,483,226 15,509,336 41,223,737 6,524,721 12,895,586 11,537,104 3,958,299 3,997,473 15,097,439 95,234,359 40,783,109 6,272,590 13,611,015 11,476,094 3,927,571 3,420,288 13,501,206 92,991,873 440,629 252,131 (715,430) 61,010 30,728 577,185 1,596,233 2,242,486 2,694,450 197,811,007 2,962,350 180,327,084 (267,899) 17,483,923 56,147,340 3,853,970 26,018,527 9,144,298 95,164,136 2,706,523 3,538,951 3,007,716 7,147,775 8,862,156 12,792,062 38,055,183 387,181 4,173,107 1,651,523 139,000 3,122,237 2,323,087 369,668 341,031 1,737,765 14,244,597 51,379,194 3,467,704 22,226,098 9,662,565 86,735,560 3,158,291 4,128,743 5,853,584 8,384,662 10,339,010 3,931,122 35,795,411 361,608 3,881,809 1,256,910 117,862 2,177,144 2,752,844 307,847 266,858 740,083 11,862,964 (4,768,147) (386,266) (3,792,430) 518,266 (8,428,576) 451,767 589,791 2,845,868 1,236,887 1,476,854 (8,860,940) (2,259,772) (25,573) (291,297) (394,613) (21,138) (945,093) 429,757 (61,821) (74,173) (997,682) (2,381,633) 16.8% 19.3% 18.4% 1.1% 4.0% (5.3%) 0.5% 0.8% 16.9% 11.8% 2.4% (9.0%) 9.7% (9.3%) (11.1%) (17.1%) 5.4% (9.7%) 14.3% 14.3% 48.6% 14.8% 14.3% (225.4%) (6.3%) (7.1%) (7.5%) (31.4%) (17.9%) (43.4%) 15.6% (20.1%) (27.8%) (134.8%) (20.1%) Airline Revenue Landing Fees Terminal Rental & Other Fees Total Airline Revenue Non-Airline Revenue Parking Ground Transportation for Hire Rental Cars Food & Beverage Retail Advertising Other Concessions, Rentals & Fees Total Non-Airline Revenue Interest Income Total Operating Revenue Operating Requirements Fac Mgmt, Ops and Airport Security Airport Planning and Development Support Services Business Services Total Operating Expense Debt Service 2013 Prosperity Bank Loan 2014 Bond Issuance 2017 Bond Issuance 2019 Refunding Bonds 2019 New Money 2022 New Money Total Debt Service Other Requirements Workers' Compensation Citywide Administrative Support Communications & Technology Mgmt Accrued Payroll Additional Retirement Contribution Operating Reserve CTECC Trunked Radio Allocation Public Works Capital Projects Mgmt Fund Total Other Requirements Total Requirements 15,347,222 18,596,037 3,248,816 17.5% 147,463,917 134,393,936 (13,069,981) (9.7%) SURPLUS (DEFICIT) OF TOTAL AVAILABLE FUNDS OVER TOTAL REQUIREMENTS 13,460,746 8,300,272 5,160,473 62.2% 50,347,090 45,933,148 4,413,942 9.6% Note: Columns may not add to totals shown because of rounding