20250514-002 Financial Report — original pdf
Backup
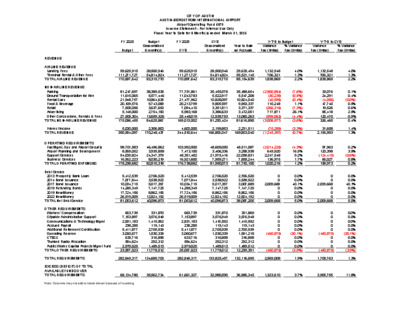
CITY OF AUSTIN AUSTIN-BERGSTROM INTERNATIONAL AIRPORT Airport Operating Fund 5070 Income Statement - For Internal Use Only Fiscal Year to Date for 6 Month(s) ended March 31, 2025 FY 2025 Budget Budget Seasonalized 6 month(s) FY 2025 CYE CYE Seasonalized 6 month(s) Y-T-D to Budget Y-T-D to CYE Year to Date w/ Accruals Variance Fav (Unfav) % Variance Fav (Unfav) Variance Fav (Unfav) % Variance Fav (Unfav) 1 13 REVENUE AIRLINE REVENUE Landing Fees Terminal Rental & Other Fees TOTAL AIRLINE REVENUE NON-AIRLINE REVENUE Parking Ground Transportation for Hire Rental Cars Food & Beverage Retail Advertising Other Concessions, Rentals & Fees TOTAL NON-AIRLINE REVENUE 59,625,915 111,271,727 170,897,642 28,500,946 54,814,824 83,315,770 59,625,915 111,271,727 170,897,642 28,500,946 54,814,824 83,315,770 29,633,494 55,521,145 85,154,639 1,132,548 706,321 1,838,869 81,247,697 11,615,065 21,948,757 20,109,576 7,508,056 5,148,000 27,509,304 175,086,455 38,389,538 5,577,446 10,864,635 9,743,089 3,637,653 2,754,180 13,659,326 84,625,867 77,751,861 11,043,783 21,477,962 20,213,799 7,094,410 5,983,168 25,448,019 169,013,002 35,455,578 5,522,917 10,828,097 9,805,597 3,351,811 3,386,633 12,939,793 81,290,424 35,488,654 5,547,208 10,824,040 9,853,337 3,371,337 3,472,051 13,060,263 81,616,890 (2,900,884) (30,239) (40,595) 110,248 (266,316) 717,871 (599,063) (3,008,977) Interest Income TOTAL REVENUE 5,000,000 350,984,097 2,306,800 170,248,437 4,600,000 344,510,644 2,199,853 166,806,047 2,231,511 169,003,040 (75,289) (1,245,397) OPERATING REQUIREMENTS Fac Mgmt, Ops and Airport Security Airport Planning and Development Support Services Business Services TOTAL OPERATING EXPENSES Debt Service 2013 Prosperity Bank Loan 2014 Bond Issuance 2017 Bond Issuance 2019 Refunding Bonds 2019 New Money 2022 New Money TOTAL Net Debt Service OTHER REQUIREMENTS Workers' Compensation Citywide Administrative Support Communications & Technology Mgmt Accrued Payroll Additional Retirement Contribution Operating Reserve CTECC Trunked Radio Allocation Public Works Capital Projects Mgmt Fund TOTAL OTHER REQUIREMENTS 98,701,583 8,569,052 54,005,824 16,962,223 178,238,682 5,412,539 7,077,844 10,034,715 14,285,349 17,724,156 26,519,009 81,053,612 663,739 7,153,897 2,831,183 238,285 5,411,877 3,060,677 633,716 584,624 2,979,025 23,557,023 46,496,862 3,935,858 24,347,379 8,030,219 82,810,318 2,706,520 3,538,922 5,017,357 7,147,725 8,862,156 12,824,192 40,096,873 331,870 3,576,949 1,415,592 119,143 2,705,939 1,530,339 316,858 292,312 1,489,513 11,778,512 103,992,500 7,473,100 48,351,482 16,921,600 176,738,682 5,412,539 7,077,844 10,034,715 14,285,349 17,724,156 26,519,009 81,053,612 663,739 7,153,897 2,831,183 238,285 5,411,877 3,060,677 633,716 584,624 2,979,025 25,057,023 48,609,050 3,406,336 21,975,416 7,959,271 81,950,073 2,706,520 3,538,922 5,017,357 7,147,725 8,862,156 12,824,192 40,096,873 331,870 3,576,949 1,415,592 119,143 2,705,939 1,530,339 316,858 292,312 1,489,513 11,778,512 48,511,087 3,285,938 22,099,831 7,893,244 81,790,100 2,706,520 3,538,922 3,007,689 7,147,725 8,862,156 12,824,192 38,087,205 331,869 3,576,948 1,415,592 119,143 2,705,939 1,991,218 316,858 292,312 1,489,512 12,239,391 (2,014,225) 649,920 2,247,548 136,975 1,020,218 0 0 2,009,668 0 0 0 2,009,668 0 0 0 0 0 (460,879) 0 0 0 (460,879) 4.0% 1.3% 2.2% (7.6%) (0.5%) (0.4%) 1.1% (7.3%) 26.1% (4.4%) (3.6%) (3.3%) (0.7%) (4.3%) 16.5% 9.2% 1.7% 1.2% 0.0% 0.0% 40.1% 0.0% 0.0% 0.0% 5.0% 0.0% 0.0% 0.0% 0.0% 0.0% (30.1%) 0.0% 0.0% 0.0% (3.9%) 1,132,548 706,321 1,838,869 33,076 24,291 (4,056) 47,740 19,526 85,418 120,470 326,465 31,658 2,196,993 97,963 120,398 (124,415) 66,027 159,973 0 0 2,009,668 0 0 0 2,009,668 0 0 0 0 0 (460,879) 0 0 0 (460,879) 4.0% 1.3% 2.2% 0.1% 0.4% (0.0%) 0.5% 0.6% 2.5% 0.9% 0.4% 1.4% 1.3% 0.2% 3.5% (0.6%) 0.8% 0.2% 0.0% 0.0% 40.1% 0.0% 0.0% 0.0% 5.0% 0.0% 0.0% 0.0% 0.0% 0.0% (30.1%) 0.0% 0.0% 0.0% (3.9%) TOTAL REQUIREMENTS 282,849,317 134,685,703 282,849,317 133,825,457 132,116,695 2,569,008 1.9% 1,708,763 1.3% EXCESS (DEFICIT) OF TOTAL AVAILABLE FUNDS OVER TOTAL REQUIREMENTS 68,134,780 35,562,734 61,661,327 32,980,590 36,886,345 1,323,610 3.7% 3,905,755 11.8% Note: Columns may not add to totals shown because of rounding CITY OF AUSTIN AUSTIN-BERGSTROM INTERNATIONAL AIRPORT INCOME STATEMENT COMPARISON THIS YEAR VS. LAST YEAR This month - This Year vs. Last Year Fiscal YTD - This Year vs. Last Year FY25 (Mar 25) vs FY24 (Mar 24) FY25 (Oct 24 - Mar 25) vs FY24 (Oct 23 - Mar 24) FY25 Mar-25 FY24 Mar-24 Fav (Unfav) $ Variance Fav (Unfav) % Variance FY25 YTD Mar-25 FY24 YTD Mar-24 Fav (Unfav) $ Variance Fav (Unfav) % Variance 5,314,454 9,472,872 14,787,326 4,322,872 7,947,557 12,270,429 991,582 1,525,315 2,516,897 6,358,369 1,046,853 1,969,296 1,786,771 644,849 844,719 2,201,457 14,852,314 6,142,787 977,118 2,063,339 1,727,260 634,655 790,630 2,034,183 14,369,973 215,582 69,735 (94,043) 59,511 10,194 54,089 167,273 482,342 22.9% 19.2% 20.5% 3.5% 7.1% (4.6%) 3.4% 1.6% 6.8% 8.2% 3.4% 29,633,494 55,521,145 85,154,639 25,554,911 46,573,317 72,128,227 4,078,583 8,947,828 13,026,411 35,488,654 5,547,208 10,824,040 9,853,337 3,371,337 3,472,051 13,060,263 81,616,890 35,027,362 5,292,341 10,977,989 9,713,372 3,296,023 3,020,180 11,540,240 78,867,508 461,292 254,866 (153,949) 139,965 75,314 451,871 1,520,023 2,749,382 410,301 30,049,942 471,001 27,111,403 (60,700) 2,938,539 (12.9%) 10.8% 2,231,511 169,003,040 2,435,039 153,430,774 (203,528) 15,572,266 7,522,977 417,047 3,696,930 1,250,087 12,887,041 8,857,694 559,211 3,971,798 1,559,620 14,948,323 1,334,717 142,164 274,868 309,533 2,061,282 451,003 589,820 836,226 1,189,604 1,477,000 2,282,470 6,826,123 55,312 596,158 235,932 19,857 416,298 331,870 52,810 48,719 248,252 2,005,207 451,338 589,820 836,226 1,196,330 1,477,104 561,589 5,112,407 51,658 554,544 179,559 16,837 435,429 393,263 43,978 38,123 105,726 1,819,117 334 0 0 6,726 104 (1,720,881) (1,713,716) (3,653) (41,614) (56,373) (3,020) 19,131 61,394 (8,832) (10,596) (142,526) (186,089) 15.1% 25.4% 6.9% 19.8% 13.8% 0.1% 0.0% 0.0% 0.6% 0.0% (306.4%) (33.5%) (7.1%) (7.5%) (31.4%) (17.9%) 4.4% 15.6% (20.1%) (27.8%) (134.8%) (10.2%) 48,511,087 3,285,938 22,099,831 7,893,244 81,790,100 44,392,374 3,026,781 19,132,619 8,374,130 74,925,904 2,706,520 3,538,922 3,007,689 7,147,725 8,862,156 12,824,192 38,087,205 331,869 3,576,948 1,415,592 119,143 2,705,939 1,991,218 316,858 292,312 1,489,512 12,239,391 2,706,953 3,538,922 5,017,358 7,188,332 8,861,906 3,369,533 30,683,004 309,950 3,327,265 1,077,351 101,025 1,886,858 2,359,581 263,868 228,735 634,356 10,188,990 (4,118,713) (259,156) (2,967,212) 480,886 (6,864,195) 433 0 2,009,669 40,607 (250) (9,454,659) (7,404,201) (21,919) (249,683) (338,240) (18,118) (819,081) 368,363 (52,990) (63,577) (855,156) (2,050,401) 16.0% 19.2% 18.1% 1.3% 4.8% (1.4%) 1.4% 2.3% 15.0% 13.2% 3.5% (8.4%) 10.1% (9.3%) (8.6%) (15.5%) 5.7% (9.2%) 0.0% 0.0% 40.1% 0.6% (0.0%) (280.6%) (24.1%) (7.1%) (7.5%) (31.4%) (17.9%) (43.4%) 15.6% (20.1%) (27.8%) (134.8%) (20.1%) Airline Revenue Landing Fees Terminal Rental & Other Fees Total Airline Revenue Non-Airline Revenue Parking Ground Transportation for Hire Rental Cars Food & Beverage Retail Advertising Other Concessions, Rentals & Fees Total Non-Airline Revenue Interest Income Total Operating Revenue Operating Requirements Fac Mgmt, Ops and Airport Security Airport Planning and Development Support Services Business Services Total Operating Expense Debt Service 2013 Prosperity Bank Loan 2014 Bond Issuance 2017 Bond Issuance 2019 Refunding Bonds 2019 New Money 2022 New Money Total Debt Service Other Requirements Workers' Compensation Citywide Administrative Support Communications & Technology Mgmt Accrued Payroll Additional Retirement Contribution Operating Reserve CTECC Trunked Radio Allocation Public Works Capital Projects Mgmt Fund Total Other Requirements Total Requirements 21,718,371 21,879,848 161,477 0.7% 132,116,695 115,797,899 (16,318,797) (14.1%) SURPLUS (DEFICIT) OF TOTAL AVAILABLE FUNDS OVER TOTAL REQUIREMENTS 8,331,571 5,231,555 3,100,016 59.3% 36,886,345 37,632,876 (746,531) (2.0%) Note: Columns may not add to totals shown because of rounding