20250409-002 Financial Report — original pdf
Backup

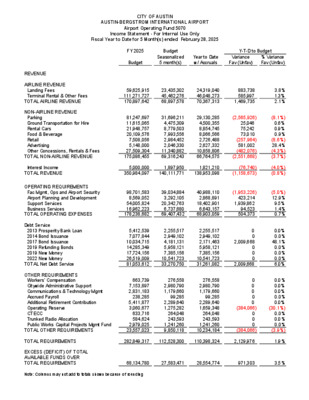
CITY OF AUSTIN AUSTIN-BERGSTROM INTERNATIONAL AIRPORT Airport Operating Fund 5070 Income Statement - For Internal Use Only Fiscal Year to Date for 5 Month(s) ended February 28, 2025 FY 2025 Budget Budget Seasonalized 5 month(s) Y-T-D to Budget Year to Date w/ Accruals Variance Fav (Unfav) % Variance Fav (Unfav) 0 11 REVENUE AIRLINE REVENUE Landing Fees Terminal Rental & Other Fees TOTAL AIRLINE REVENUE NON-AIRLINE REVENUE Parking Ground Transportation for Hire Rental Cars Food & Beverage Retail Advertising Other Concessions, Rentals & Fees TOTAL NON-AIRLINE REVENUE Interest Income TOTAL REVENUE 5,000,000 350,984,097 1,897,950 140,111,771 1,821,210 138,953,098 (76,740) (1,158,673) 59,625,915 111,271,727 170,897,642 23,435,302 45,462,276 68,897,578 24,319,040 46,048,273 70,367,313 883,738 585,997 1,469,735 81,247,697 11,615,065 21,948,757 20,109,576 7,508,056 5,148,000 27,509,304 175,086,455 31,696,211 4,475,309 8,779,503 7,993,556 2,984,452 2,046,330 11,340,882 69,316,243 29,130,285 4,500,355 8,854,745 8,066,566 2,726,488 2,627,332 10,858,806 66,764,575 (2,565,926) 25,046 75,242 73,010 (257,964) 581,002 (482,076) (2,551,668) 98,701,583 8,569,052 54,005,824 16,962,223 178,238,682 5,412,539 7,077,844 10,034,715 14,285,349 17,724,156 26,519,009 81,053,612 663,739 7,153,897 2,831,183 238,285 5,411,877 3,060,677 633,716 584,624 2,979,025 23,557,023 39,034,884 3,292,105 20,342,763 6,737,680 69,407,432 2,255,517 2,949,102 4,181,131 5,958,121 7,385,156 10,541,723 33,270,750 276,558 2,980,790 1,179,660 99,285 2,289,640 1,275,282 264,048 243,593 1,241,260 9,850,118 40,988,110 2,868,891 18,402,901 6,643,157 68,903,059 2,255,517 2,949,102 2,171,463 5,958,121 7,385,156 10,541,723 31,261,082 276,558 2,980,790 1,179,660 99,285 2,289,640 1,659,348 264,048 243,593 1,241,260 10,234,184 (1,953,226) 423,214 1,939,862 94,523 504,373 0 0 2,009,668 0 0 0 2,009,668 0 0 0 0 0 (384,066) 0 0 0 (384,066) 3.8% 1.3% 2.1% (8.1%) 0.6% 0.9% 0.9% (8.6%) 28.4% (4.3%) (3.7%) (4.0%) (0.8%) (5.0%) 12.9% 9.5% 1.4% 0.7% 0.0% 0.0% 48.1% 0.0% 0.0% 0.0% 6.0% 0.0% 0.0% 0.0% 0.0% 0.0% (30.1%) 0.0% 0.0% 0.0% (3.9%) OPERATING REQUIREMENTS Fac Mgmt, Ops and Airport Security Airport Planning and Development Support Services Business Services TOTAL OPERATING EXPENSES Debt Service 2013 Prosperity Bank Loan 2014 Bond Issuance 2017 Bond Issuance 2019 Refunding Bonds 2019 New Money 2022 New Money TOTAL Net Debt Service OTHER REQUIREMENTS Workers' Compensation Citywide Administrative Support Communications & Technology Mgmt Accrued Payroll Additional Retirement Contribution Operating Reserve CTECC Trunked Radio Allocation Public Works Capital Projects Mgmt Fund TOTAL OTHER REQUIREMENTS TOTAL REQUIREMENTS 282,849,317 112,528,300 110,398,324 2,129,976 1.9% EXCESS (DEFICIT) OF TOTAL AVAILABLE FUNDS OVER TOTAL REQUIREMENTS Note: Columns may not add to totals shown because of rounding 68,134,780 27,583,471 28,554,774 971,303 3.5% CITY OF AUSTIN AUSTIN-BERGSTROM INTERNATIONAL AIRPORT INCOME STATEMENT COMPARISON THIS YEAR VS. LAST YEAR This month - This Year vs. Last Year Fiscal YTD - This Year vs. Last Year FY25 (Feb 25) vs FY24 (Feb 24) FY25 (Oct 24 - Feb 25) vs FY24 (Oct 23 - Feb 24) FY25 Feb-25 FY24 Feb-24 Fav (Unfav) $ Variance Fav (Unfav) % Variance FY25 YTD Feb-25 FY24 YTD Feb-24 Fav (Unfav) $ Variance Fav (Unfav) % Variance 4,272,282 8,816,587 13,088,869 3,574,769 7,855,674 11,430,443 697,513 960,913 1,658,426 24,319,040 46,048,273 70,367,313 21,232,039 38,625,759 59,857,798 3,087,001 7,422,513 10,509,514 4,999,421 814,850 1,534,710 1,445,851 472,810 364,507 2,089,288 11,721,436 5,126,040 788,790 1,527,042 1,408,231 479,586 358,686 1,716,691 11,405,066 (126,620) 26,060 7,669 37,620 (6,776) 5,820 372,596 316,370 29,130,285 4,500,355 8,854,745 8,066,566 2,726,488 2,627,332 10,858,806 66,764,575 28,884,575 4,315,223 8,914,651 7,986,112 2,661,368 2,229,551 9,506,056 64,497,535 245,710 185,132 (59,906) 80,454 65,120 397,781 1,352,750 2,267,041 357,415 25,167,721 402,954 23,238,463 (45,538) 1,929,257 (11.3%) 8.3% 1,821,210 138,953,098 1,964,038 126,319,371 (142,828) 12,633,726 8,028,282 373,855 3,603,008 1,104,952 13,110,096 7,117,162 439,270 3,189,796 1,283,698 12,029,927 451,003 589,820 836,226 1,189,604 1,477,000 2,282,470 6,826,123 55,312 596,158 235,932 19,857 416,298 331,870 52,810 48,719 248,252 2,005,207 451,338 589,820 836,226 1,196,330 1,477,104 561,589 5,112,407 51,658 554,544 179,559 16,837 290,286 393,263 43,978 38,123 105,726 1,673,974 (911,120) 65,415 (413,212) 178,746 (1,080,170) 334 0 0 6,726 104 (1,720,881) (1,713,716) (3,653) (41,614) (56,373) (3,020) (126,012) 61,394 (8,832) (10,596) (142,526) (331,232) 40,988,110 2,868,891 18,402,901 6,643,157 68,903,059 2,255,517 2,949,102 2,171,463 5,958,121 7,385,156 10,541,723 31,261,082 276,558 2,980,790 1,179,660 99,285 2,289,640 1,659,348 264,048 243,593 1,241,260 10,234,184 35,534,680 2,467,571 15,160,821 6,814,510 59,977,581 2,255,616 2,949,102 4,181,131 5,992,002 7,384,802 2,807,944 25,570,597 258,292 2,772,721 897,793 84,187 1,451,429 1,966,317 219,890 190,613 528,630 8,369,872 (5,453,430) (401,320) (3,242,080) 171,353 (8,925,477) 98 0 2,009,669 33,881 (354) (7,733,779) (5,690,485) (18,266) (208,070) (281,867) (15,098) (838,211) 306,969 (44,158) (52,980) (712,630) (1,864,311) 19.5% 12.2% 14.5% (2.5%) 3.3% 0.5% 2.7% (1.4%) 1.6% 21.7% 2.8% (12.8%) 14.9% (13.0%) 13.9% (9.0%) 0.1% 0.0% 0.0% 0.6% 0.0% (306.4%) (33.5%) (7.1%) (7.5%) (31.4%) (17.9%) (43.4%) 15.6% (20.1%) (27.8%) (134.8%) (19.8%) 14.5% 19.2% 17.6% 0.9% 4.3% (0.7%) 1.0% 2.4% 17.8% 14.2% 3.5% (7.3%) 10.0% (15.3%) (16.3%) (21.4%) 2.5% (14.9%) 0.0% 0.0% 48.1% 0.6% (0.0%) (275.4%) (22.3%) (7.1%) (7.5%) (31.4%) (17.9%) (57.8%) 15.6% (20.1%) (27.8%) (134.8%) (22.3%) Airline Revenue Landing Fees Terminal Rental & Other Fees Total Airline Revenue Non-Airline Revenue Parking Ground Transportation for Hire Rental Cars Food & Beverage Retail Advertising Other Concessions, Rentals & Fees Total Non-Airline Revenue Interest Income Total Operating Revenue Operating Requirements Fac Mgmt, Ops and Airport Security Airport Planning and Development Support Services Business Services Total Operating Expense Debt Service 2013 Prosperity Bank Loan 2014 Bond Issuance 2017 Bond Issuance 2019 Refunding Bonds 2019 New Money 2022 New Money Total Debt Service Other Requirements Workers' Compensation Citywide Administrative Support Communications & Technology Mgmt Accrued Payroll Additional Retirement Contribution Operating Reserve CTECC Trunked Radio Allocation Public Works Capital Projects Mgmt Fund Total Other Requirements Total Requirements 21,941,427 18,816,308 (3,125,118) (16.6%) 110,398,324 93,918,051 (16,480,273) (17.5%) SURPLUS (DEFICIT) OF TOTAL AVAILABLE FUNDS OVER TOTAL REQUIREMENTS Note: Columns may not add to totals shown because of rounding 3,226,294 4,422,155 (1,195,861) (27.0%) 28,554,774 32,401,321 (3,846,547) (11.9%)