20250312-002 Financial Report — original pdf
Backup
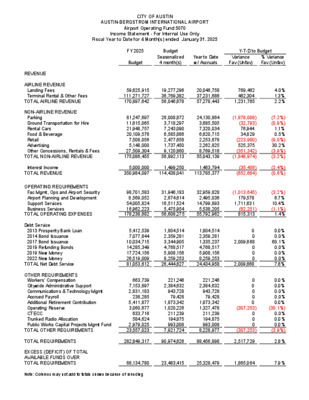
CITY OF AUSTIN AUSTIN-BERGSTROM INTERNATIONAL AIRPORT Airport Operating Fund 5070 Income Statement - For Internal Use Only Fiscal Year to Date for 4 Month(s) ended January 31, 2025 FY 2025 Budget Budget Seasonalized 4 month(s) Y-T-D to Budget Year to Date w/ Accruals Variance Fav (Unfav) % Variance Fav (Unfav) 0 9 REVENUE AIRLINE REVENUE Landing Fees Terminal Rental & Other Fees TOTAL AIRLINE REVENUE NON-AIRLINE REVENUE Parking Ground Transportation for Hire Rental Cars Food & Beverage Retail Advertising Other Concessions, Rentals & Fees TOTAL NON-AIRLINE REVENUE Interest Income TOTAL REVENUE 5,000,000 350,984,097 1,499,250 114,438,041 1,463,794 113,785,377 (35,456) (652,664) 59,625,915 111,271,727 170,897,642 19,277,296 36,769,382 56,046,678 20,046,758 37,231,686 57,278,443 769,462 462,304 1,231,765 81,247,697 11,615,065 21,948,757 20,109,576 7,508,056 5,148,000 27,509,304 175,086,455 26,008,872 3,718,297 7,243,090 6,585,886 2,477,658 1,737,450 9,120,860 56,892,113 24,130,864 3,685,505 7,320,034 6,620,715 2,253,678 2,262,825 8,769,518 55,043,139 (1,878,008) (32,793) 76,944 34,829 (223,980) 525,375 (351,342) (1,848,974) 98,701,583 8,569,052 54,005,824 16,962,223 178,238,682 5,412,539 7,077,844 10,034,715 14,285,349 17,724,156 26,519,009 81,053,612 663,739 7,153,897 2,831,183 238,285 5,411,877 3,060,677 633,716 584,624 2,979,025 23,557,023 31,946,183 2,674,614 16,511,524 5,475,954 56,608,275 1,804,514 2,359,281 3,344,905 4,768,517 5,908,156 8,259,253 26,444,627 221,246 2,384,632 943,728 79,428 1,873,342 1,020,226 211,239 194,875 993,008 7,921,724 32,959,828 2,495,036 14,799,893 5,538,205 55,792,962 1,804,514 2,359,281 1,335,237 4,768,517 5,908,156 8,259,253 24,434,958 221,246 2,384,632 943,728 79,428 1,873,342 1,327,478 211,239 194,875 993,008 8,228,977 (1,013,645) 179,578 1,711,631 (62,251) 815,313 0 0 2,009,668 0 0 0 2,009,668 0 0 0 0 0 (307,253) 0 0 0 (307,253) 4.0% 1.3% 2.2% (7.2%) (0.9%) 1.1% 0.5% (9.0%) 30.2% (3.9%) (3.2%) (2.4%) (0.6%) (3.2%) 6.7% 10.4% (1.1%) 1.4% 0.0% 0.0% 60.1% 0.0% 0.0% 0.0% 7.6% 0.0% 0.0% 0.0% 0.0% 0.0% (30.1%) 0.0% 0.0% 0.0% (3.9%) OPERATING REQUIREMENTS Fac Mgmt, Ops and Airport Security Airport Planning and Development Support Services Business Services TOTAL OPERATING EXPENSES Debt Service 2013 Prosperity Bank Loan 2014 Bond Issuance 2017 Bond Issuance 2019 Refunding Bonds 2019 New Money 2022 New Money TOTAL Net Debt Service OTHER REQUIREMENTS Workers' Compensation Citywide Administrative Support Communications & Technology Mgmt Accrued Payroll Additional Retirement Contribution Operating Reserve CTECC Trunked Radio Allocation Public Works Capital Projects Mgmt Fund TOTAL OTHER REQUIREMENTS TOTAL REQUIREMENTS 282,849,317 90,974,626 88,456,898 2,517,729 2.8% EXCESS (DEFICIT) OF TOTAL AVAILABLE FUNDS OVER TOTAL REQUIREMENTS Note: Columns may not add to totals shown because of rounding 68,134,780 23,463,415 25,328,479 1,865,064 7.9% CITY OF AUSTIN AUSTIN-BERGSTROM INTERNATIONAL AIRPORT INCOME STATEMENT COMPARISON THIS YEAR VS. LAST YEAR This month - This Year vs. Last Year Fiscal YTD - This Year vs. Last Year FY25 (Jan 25) vs FY24 (Jan 24) FY25 (Oct 24 - Jan 25) vs FY24 (Oct 23 - Jan 24) FY25 Jan-25 FY24 Jan-24 Fav (Unfav) $ Variance Fav (Unfav) % Variance FY25 YTD Jan-25 FY24 YTD Jan-24 Fav (Unfav) $ Variance Fav (Unfav) % Variance 4,420,719 8,924,516 13,345,235 3,857,062 7,757,837 11,614,899 563,657 1,166,679 1,730,336 20,046,758 37,231,686 57,278,443 17,657,270 30,770,085 48,427,355 2,389,488 6,461,601 8,851,088 5,378,470 757,829 1,534,710 1,472,800 442,900 348,871 2,166,837 12,102,418 5,286,084 746,948 1,516,146 1,422,189 436,975 311,328 1,892,349 11,612,020 92,387 10,880 18,564 50,611 5,925 37,542 274,488 490,398 24,130,864 3,685,505 7,320,034 6,620,715 2,253,678 2,262,825 8,769,518 55,043,139 23,758,534 3,526,433 7,387,609 6,577,881 2,181,782 1,870,864 7,789,365 53,092,468 372,330 159,071 (67,575) 42,834 71,896 391,961 980,153 1,950,671 341,255 25,788,907 372,367 23,599,287 (31,113) 2,189,621 1,463,794 113,785,377 1,561,085 103,080,908 (97,290) 10,704,469 9,699,615 749,835 4,394,602 1,568,053 16,412,105 7,075,924 446,425 3,029,254 1,388,344 11,939,946 451,003 589,820 836,226 1,189,604 1,477,000 2,282,470 6,826,123 55,312 596,158 235,932 19,857 624,447 331,870 52,810 48,719 248,252 2,213,356 451,338 589,820 836,226 1,196,331 1,477,104 561,589 5,112,408 51,658 554,544 179,559 16,837 290,286 393,263 43,978 38,123 105,726 1,673,975 (2,623,692) (303,411) (1,365,348) (179,709) (4,472,159) 334 0 0 6,727 104 (1,720,881) (1,713,715) (3,653) (41,614) (56,373) (3,020) (334,162) 61,394 (8,832) (10,596) (142,526) (539,382) 32,959,828 2,495,036 14,799,893 5,538,205 55,792,962 1,804,514 2,359,281 1,335,237 4,768,517 5,908,156 8,259,253 24,434,958 221,246 2,384,632 943,728 79,428 1,873,342 1,327,478 211,239 194,875 993,008 8,228,977 28,417,518 2,028,301 11,971,024 5,530,812 47,947,655 1,804,278 2,359,281 3,344,905 4,795,672 5,907,698 2,246,355 20,458,190 206,633 2,218,177 718,234 67,350 1,161,143 1,573,054 175,912 152,490 422,904 6,695,898 (4,542,310) (466,736) (2,828,868) (7,393) (7,845,308) (236) 0 2,009,669 27,155 (458) (6,012,898) (3,976,769) (14,613) (166,456) (225,493) (12,079) (712,199) 245,575 (35,326) (42,384) (570,104) (1,533,079) 14.6% 15.0% 14.9% 1.7% 1.5% 1.2% 3.6% 1.4% 12.1% 14.5% 4.2% (8.4%) 9.3% (37.1%) (68.0%) (45.1%) (12.9%) (37.5%) 0.1% 0.0% 0.0% 0.6% 0.0% (306.4%) (33.5%) (7.1%) (7.5%) (31.4%) (17.9%) (115.1%) 15.6% (20.1%) (27.8%) (134.8%) (32.2%) 13.5% 21.0% 18.3% 1.6% 4.5% (0.9%) 0.7% 3.3% 21.0% 12.6% 3.7% (6.2%) 10.4% (16.0%) (23.0%) (23.6%) (0.1%) (16.4%) (0.0%) 0.0% 60.1% 0.6% (0.0%) (267.7%) (19.4%) (7.1%) (7.5%) (31.4%) (17.9%) (61.3%) 15.6% (20.1%) (27.8%) (134.8%) (22.9%) Airline Revenue Landing Fees Terminal Rental & Other Fees Total Airline Revenue Non-Airline Revenue Parking Ground Transportation for Hire Rental Cars Food & Beverage Retail Advertising Other Concessions, Rentals & Fees Total Non-Airline Revenue Interest Income Total Operating Revenue Operating Requirements Fac Mgmt, Ops and Airport Security Airport Planning and Development Support Services Business Services Total Operating Expense Debt Service 2013 Prosperity Bank Loan 2014 Bond Issuance 2017 Bond Issuance 2019 Refunding Bonds 2019 New Money 2022 New Money Total Debt Service Other Requirements Workers' Compensation Citywide Administrative Support Communications & Technology Mgmt Accrued Payroll Additional Retirement Contribution Operating Reserve CTECC Trunked Radio Allocation Public Works Capital Projects Mgmt Fund Total Other Requirements Total Requirements 25,451,585 18,726,328 (6,725,256) (35.9%) 88,456,898 75,101,742 (13,355,155) (17.8%) SURPLUS (DEFICIT) OF TOTAL AVAILABLE FUNDS OVER TOTAL REQUIREMENTS Note: Columns may not add to totals shown because of rounding 337,323 4,872,958 (4,535,636) (93.1%) 25,328,479 27,979,166 (2,650,686) (9.5%)