20250212-002 Financial Report — original pdf
Backup
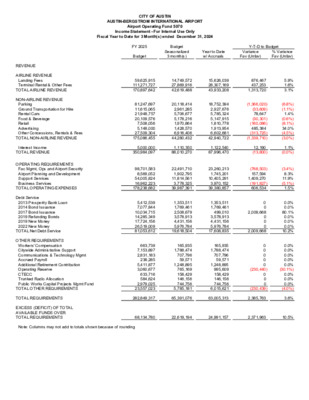
CITY OF AUSTIN AUSTIN-BERGSTROM INTERNATIONAL AIRPORT Airport Operating Fund 5070 Income Statement - For Internal Use Only Fiscal Year to Date for 3 Month(s) ended December 31, 2024 FY 2025 Budget Budget Seasonalized 3 month(s) Year to Date w/ Accruals Variance Fav (Unfav) % Variance Fav (Unfav) Y-T-D to Budget 0 6 REVENUE AIRLINE REVENUE Landing Fees Terminal Rental & Other Fees TOTAL AIRLINE REVENUE NON-AIRLINE REVENUE Parking Ground Transportation for Hire Rental Cars Food & Beverage Retail Advertising Other Concessions, Rentals & Fees TOTAL NON-AIRLINE REVENUE Interest Income TOTAL REVENUE OPERATING REQUIREMENTS Fac Mgmt, Ops and Airport Security Airport Planning and Development Support Services Business Services 2013 Prosperity Bank Loan 2014 Bond Issuance 2017 Bond Issuance 2019 Refunding Bonds 2019 New Money 2022 New Money TOTAL Net Debt Service OTHER REQUIREMENTS Workers' Compensation Citywide Administrative Support Communications & Technology Mgmt Accrued Payroll Additional Retirement Contribution Operating Reserve CTECC Trunked Radio Allocation Public Works Capital Projects Mgmt Fund TOTAL OTHER REQUIREMENTS EXCESS (DEFICIT) OF TOTAL AVAILABLE FUNDS OVER TOTAL REQUIREMENTS TOTAL OPERATING EXPENSES Debt Service 59,625,915 111,271,727 170,897,642 81,247,697 11,615,065 21,948,757 20,109,576 7,508,056 5,148,000 27,509,304 175,086,455 5,000,000 350,984,097 98,701,583 8,569,052 54,005,824 16,962,223 178,238,682 5,412,539 7,077,844 10,034,715 14,285,349 17,724,156 26,519,009 81,053,612 663,739 7,153,897 2,831,183 238,285 5,411,877 3,060,677 633,716 584,624 2,979,025 23,557,023 14,749,572 27,869,916 42,619,488 20,118,414 2,961,285 5,706,677 5,178,216 1,970,864 1,428,570 6,916,406 44,280,432 1,110,350 88,010,270 22,491,710 1,902,795 11,814,561 3,778,325 39,987,391 1,353,511 1,769,461 2,508,679 3,578,913 4,431,156 5,976,784 19,618,504 165,935 1,788,474 707,796 59,571 1,248,895 765,169 158,429 146,156 744,756 5,785,181 15,626,039 28,307,169 43,933,208 18,752,394 2,927,676 5,785,324 5,147,915 1,810,778 1,913,954 6,602,681 42,940,722 1,122,540 87,996,470 23,260,213 1,745,201 10,405,291 3,970,152 39,380,857 1,353,511 1,769,461 499,010 3,578,913 4,431,156 5,976,784 17,608,835 165,935 1,788,474 707,796 59,571 1,248,895 995,609 158,429 146,156 744,756 6,015,621 876,467 437,253 1,313,720 (1,366,020) (33,609) 78,647 (30,301) (160,086) 485,384 (313,725) (1,339,710) 12,190 (13,800) (768,503) 157,594 1,409,270 (191,827) 606,534 0 0 2,009,668 0 0 0 2,009,668 0 0 0 0 0 (230,440) 0 0 0 (230,439) 5.9% 1.6% 3.1% (6.8%) (1.1%) 1.4% (0.6%) (8.1%) 34.0% (4.5%) (3.0%) 1.1% (0.0%) (3.4%) 8.3% 11.9% (5.1%) 1.5% 0.0% 0.0% 80.1% 0.0% 0.0% 0.0% 10.2% 0.0% 0.0% 0.0% 0.0% 0.0% (30.1%) 0.0% 0.0% 0.0% (4.0%) TOTAL REQUIREMENTS 282,849,317 65,391,076 63,005,313 2,385,763 3.6% Note: Columns may not add to totals shown because of rounding 68,134,780 22,619,194 24,991,157 2,371,963 10.5% CITY OF AUSTIN AUSTIN-BERGSTROM INTERNATIONAL AIRPORT INCOME STATEMENT COMPARISON THIS YEAR VS. LAST YEAR This month - This Year vs. Last Year FY25 (Dec 24) vs FY24 (Dec 23) Fiscal YTD - This Year vs. Last Year FY25 (Oct 24 - Dec 24) vs FY24 (Oct 23 - Dec 23) FY25 Dec-24 FY24 Dec-23 Fav (Unfav) $ Variance Fav (Unfav) % Variance FY25 YTD Dec-24 FY24 YTD Dec-23 Fav (Unfav) $ Variance Fav (Unfav) % Variance 5,128,530 9,666,717 14,795,247 4,474,751 7,555,187 12,029,939 6,221,598 909,236 1,612,317 1,699,449 535,051 426,113 2,196,561 13,600,324 5,756,718 785,393 1,553,554 1,615,019 483,699 413,924 1,919,729 12,528,035 292,142 28,687,714 311,712 24,869,685 7,700,872 553,127 3,558,425 1,402,347 13,214,770 6,826,386 466,420 3,125,381 1,360,178 11,778,365 451,003 589,820 497,723 1,189,604 1,477,000 2,282,470 6,487,620 55,312 596,158 235,932 19,857 416,298 331,870 52,810 48,719 248,252 2,005,207 451,338 589,820 836,226 1,196,331 1,477,104 561,589 5,112,408 51,658 554,544 179,559 16,837 290,286 393,263 43,978 38,123 105,726 1,673,975 653,779 2,111,530 2,765,309 464,880 123,844 58,763 84,429 51,352 12,189 276,832 1,072,289 (19,570) 3,818,028 (874,486) (86,706) (433,044) (42,169) (1,436,405) 334 0 338,503 6,727 104 (1,720,881) (1,375,212) (3,653) (41,614) (56,373) (3,020) (126,012) 61,394 (8,832) (10,596) (142,526) (331,232) 14.6% 27.9% 23.0% 8.1% 15.8% 3.8% 5.2% 10.6% 2.9% 14.4% 8.6% (6.3%) 15.4% (12.8%) (18.6%) (13.9%) (3.1%) (12.2%) 0.1% 0.0% 40.5% 0.6% 0.0% (306.4%) (26.9%) (7.1%) (7.5%) (31.4%) (17.9%) (43.4%) 15.6% (20.1%) (27.8%) (134.8%) (19.8%) 15,626,039 28,307,169 43,933,208 18,752,394 2,927,676 5,785,324 5,147,915 1,810,778 1,913,954 6,602,681 42,940,722 1,122,540 87,996,470 23,260,213 1,745,201 10,405,291 3,970,152 39,380,857 1,353,511 1,769,461 499,010 3,578,913 4,431,156 5,976,784 17,608,835 165,935 1,788,474 707,796 59,571 1,248,895 995,609 158,429 146,156 744,756 6,015,621 13,800,208 23,012,248 36,812,456 18,472,451 2,779,485 5,871,462 5,155,692 1,744,806 1,559,536 5,897,016 41,480,449 1,188,717 79,481,621 21,341,594 1,581,876 8,941,771 4,142,468 36,007,709 1,352,941 1,769,461 2,508,679 3,599,341 4,430,594 1,684,766 15,345,782 154,975 1,663,633 538,676 50,512 870,858 1,179,790 131,934 114,368 317,178 5,021,923 1,825,831 5,294,922 7,120,753 279,943 148,191 (86,139) (7,777) 65,971 354,419 705,665 1,460,273 (66,177) 8,514,848 (1,918,619) (163,325) (1,463,520) 172,316 (3,373,148) (570) 0 2,009,669 20,428 (563) (4,292,017) (2,263,053) (10,960) (124,842) (169,120) (9,059) (378,037) 184,182 (26,495) (31,788) (427,578) (993,697) 13.2% 23.0% 19.3% 1.5% 5.3% (1.5%) (0.2%) 3.8% 22.7% 12.0% 3.5% (5.6%) 10.7% (9.0%) (10.3%) (16.4%) 4.2% (9.4%) (0.0%) 0.0% 80.1% 0.6% (0.0%) (254.8%) (14.7%) (7.1%) (7.5%) (31.4%) (17.9%) (43.4%) 15.6% (20.1%) (27.8%) (134.8%) (19.8%) Airline Revenue Landing Fees Terminal Rental & Other Fees Total Airline Revenue Non-Airline Revenue Parking Ground Transportation for Hire Rental Cars Food & Beverage Retail Advertising Other Concessions, Rentals & Fees Total Non-Airline Revenue Interest Income Total Operating Revenue Operating Requirements Fac Mgmt, Ops and Airport Security Airport Planning and Development Support Services Business Services Total Operating Expense Debt Service 2013 Prosperity Bank Loan 2014 Bond Issuance 2017 Bond Issuance 2019 Refunding Bonds 2019 New Money 2022 New Money Total Debt Service Other Requirements Workers' Compensation Citywide Administrative Support Communications & Technology Mgmt Accrued Payroll Additional Retirement Contribution Operating Reserve CTECC Trunked Radio Allocation Public Works Capital Projects Mgmt Fund Total Other Requirements Total Requirements 21,707,597 18,564,748 (3,142,849) (16.9%) 63,005,313 56,375,414 (6,629,899) (11.8%) SURPLUS (DEFICIT) OF TOTAL AVAILABLE FUNDS OVER TOTAL REQUIREMENTS Note: Columns may not add to totals shown because of rounding 6,980,116 6,304,938 675,179 10.7% 24,991,157 23,106,207 1,884,949 8.2%