20250108-002 Financial Report — original pdf
Backup

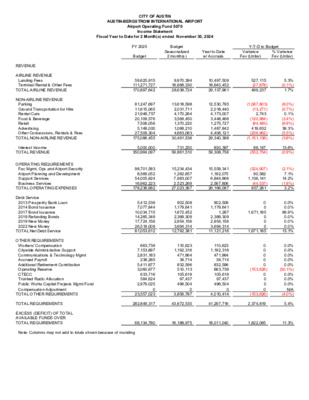
CITY OF AUSTIN AUSTIN-BERGSTROM INTERNATIONAL AIRPORT Airport Operating Fund 5070 Income Statement Fiscal Year to Date for 2 Month(s) ended November 30, 2024 FY 2025 Budget Budget Seasonalized 2 month(s) Year to Date w/ Accruals Variance Fav (Unfav) % Variance Fav (Unfav) Y-T-D to Budget 0 4 REVENUE AIRLINE REVENUE Landing Fees Terminal Rental & Other Fees TOTAL AIRLINE REVENUE NON-AIRLINE REVENUE Parking Ground Transportation for Hire Rental Cars Food & Beverage Retail Advertising Other Concessions, Rentals & Fees TOTAL NON-AIRLINE REVENUE Interest Income TOTAL REVENUE OPERATING REQUIREMENTS Fac Mgmt, Ops and Airport Security Airport Planning and Development Support Services Business Services 2013 Prosperity Bank Loan 2014 Bond Issuance 2017 Bond Issuance 2019 Refunding Bonds 2019 New Money 2022 New Money TOTAL Net Debt Service OTHER REQUIREMENTS Workers' Compensation Citywide Administrative Support Communications & Technology Mgmt Accrued Payroll Additional Retirement Contribution Operating Reserve CTECC Trunked Radio Allocation Public Works Capital Projects Mgmt Fund Compensation Adjustment TOTAL OTHER REQUIREMENTS EXCESS (DEFICIT) OF TOTAL AVAILABLE FUNDS OVER TOTAL REQUIREMENTS TOTAL OPERATING EXPENSES Debt Service 59,625,915 111,271,727 170,897,642 81,247,697 11,615,065 21,948,757 20,109,576 7,508,056 5,148,000 27,509,304 175,086,455 5,000,000 350,984,097 98,701,583 8,569,052 54,005,824 16,962,223 178,238,682 5,412,539 7,077,844 10,034,715 14,285,349 17,724,156 26,519,009 81,053,612 663,739 7,153,897 2,831,183 238,285 5,411,877 3,060,677 633,716 584,624 2,979,025 0 23,557,023 9,970,394 18,668,330 28,638,724 13,618,598 2,031,711 4,170,264 3,569,450 1,370,220 1,068,210 4,663,083 30,491,536 731,250 59,861,510 15,234,434 1,282,657 7,983,007 2,523,269 27,023,367 902,508 1,179,641 1,672,452 2,389,309 2,954,156 3,694,314 12,792,381 110,623 1,192,316 471,864 39,714 832,596 510,113 105,619 97,437 496,504 0 3,856,787 10,497,509 18,640,452 29,137,961 12,530,795 2,018,440 4,173,007 3,448,466 1,275,727 1,487,842 4,406,121 29,340,398 830,397 59,308,756 15,559,341 1,192,075 6,846,866 2,567,806 26,166,087 902,508 1,179,641 1,287 2,389,309 2,954,156 3,694,314 11,121,216 110,623 1,192,316 471,864 39,714 832,596 663,739 105,619 97,437 496,504 0 4,010,414 527,115 (27,878) 499,237 (1,087,803) (13,271) 2,743 (120,984) (94,493) 419,632 (256,962) (1,151,138) 99,147 (552,754) (324,907) 90,582 1,136,141 (44,537) 857,281 0 0 1,671,165 0 0 0 1,671,165 0 0 0 0 0 (153,626) 0 0 0 0 (153,626) 5.3% (0.1%) 1.7% (8.0%) (0.7%) 0.1% (3.4%) (6.9%) 39.3% (5.5%) (3.8%) 13.6% (0.9%) (2.1%) 7.1% 14.2% (1.8%) 3.2% 0.0% 0.0% 99.9% 0.0% 0.0% 0.0% 13.1% 0.0% 0.0% 0.0% 0.0% 0.0% (30.1%) 0.0% 0.0% 0.0% N/A (4.0%) TOTAL REQUIREMENTS 282,849,317 43,672,535 41,297,716 2,374,819 5.4% Note: Columns may not add to totals shown because of rounding 68,134,780 16,188,975 18,011,040 1,822,065 11.3% CITY OF AUSTIN AUSTIN-BERGSTROM INTERNATIONAL AIRPORT INCOME STATEMENT COMPARISON THIS YEAR VS. LAST YEAR This month - This Year vs. Last Year FY25 (Nov 24) vs FY24 (Nov 23) Fiscal YTD - This Year vs. Last Year FY25 (Oct 24 - Nov 24) vs FY24 (Oct 23 - Nov 23) FY25 Nov-24 FY24 Nov-23 Fav (Unfav) $ Variance Fav (Unfav) % Variance FY25 YTD Nov-24 FY24 YTD Nov-23 Fav (Unfav) $ Variance Fav (Unfav) % Variance 5,038,500 9,305,528 14,344,028 4,486,177 7,748,213 12,234,390 5,745,887 921,214 1,875,893 1,633,990 556,664 466,762 2,175,687 13,376,096 5,953,542 950,074 1,952,899 1,692,874 540,320 392,883 1,928,338 13,410,930 361,139 28,081,264 387,810 26,033,130 8,486,452 666,632 3,567,231 1,229,521 13,949,835 8,091,913 618,941 3,263,040 1,407,484 13,381,378 451,170 589,820 (174) 1,192,971 1,477,052 1,992,261 5,703,101 55,312 596,158 235,932 19,857 416,298 331,870 52,810 48,719 248,252 2,005,207 450,980 589,820 836,226 1,199,780 1,476,865 561,589 5,115,261 51,658 554,544 179,559 16,837 290,286 393,263 43,978 38,123 105,726 1,673,974 552,323 1,557,316 2,109,639 (207,655) (28,860) (77,007) (58,884) 16,343 73,879 247,349 (34,834) (26,671) 2,048,134 (394,539) (47,691) (304,190) 177,962 (568,457) (190) 0 836,400 6,809 (187) (1,430,672) (587,841) (3,653) (41,614) (56,373) (3,020) (126,012) 61,394 (8,832) (10,596) (142,526) (331,232) 12.3% 20.1% 17.2% (3.5%) (3.0%) (3.9%) (3.5%) 3.0% 18.8% 12.8% (0.3%) (6.9%) 7.9% (4.9%) (7.7%) (9.3%) 12.6% (4.2%) (0.0%) 0.0% 100.0% 0.6% (0.0%) (254.8%) (11.5%) (7.1%) (7.5%) (31.4%) (17.9%) (43.4%) 15.6% (20.1%) (27.8%) (134.8%) (19.8%) 10,497,509 18,640,452 29,137,961 12,530,795 2,018,440 4,173,007 3,448,466 1,275,727 1,487,842 4,406,121 29,340,398 830,397 59,308,756 15,559,341 1,192,075 6,846,866 2,567,806 26,166,087 902,508 1,179,641 1,287 2,389,309 2,954,156 3,694,314 11,121,216 110,623 1,192,316 471,864 39,714 832,596 663,739 105,619 97,437 496,504 4,010,414 9,325,457 15,457,060 24,782,517 12,715,733 1,994,093 4,317,909 3,540,673 1,261,108 1,145,612 3,977,287 28,952,414 877,005 54,611,936 14,515,208 1,115,455 5,816,390 2,782,290 24,229,343 901,603 1,179,641 1,672,453 2,403,010 2,953,490 1,123,178 10,233,374 103,317 1,109,088 359,117 33,675 580,572 786,527 87,956 76,245 211,452 3,347,949 1,172,052 3,183,392 4,355,444 (184,938) 24,348 (144,901) (92,207) 14,619 342,230 428,834 387,984 (46,608) 4,696,820 (1,044,133) (76,619) (1,030,476) 214,484 (1,936,743) (905) 0 1,671,165 13,701 (667) (2,571,136) (887,842) (7,307) (83,228) (112,747) (6,039) (252,025) 122,788 (17,663) (21,192) (285,052) (662,465) 12.6% 20.6% 17.6% (1.5%) 1.2% (3.4%) (2.6%) 1.2% 29.9% 10.8% 1.3% (5.3%) 8.6% (7.2%) (6.9%) (17.7%) 7.7% (8.0%) (0.1%) 0.0% 99.9% 0.6% (0.0%) (228.9%) (8.7%) (7.1%) (7.5%) (31.4%) (17.9%) (43.4%) 15.6% (20.1%) (27.8%) (134.8%) (19.8%) Airline Revenue Landing Fees Terminal Rental & Other Fees Total Airline Revenue Non-Airline Revenue Parking Ground Transportation for Hire Rental Cars Food & Beverage Retail Advertising Other Concessions, Rentals & Fees Total Non-Airline Revenue Interest Income Total Operating Revenue Operating Requirements Fac Mgmt, Ops and Airport Security Airport Planning and Development Support Services Business Services Total Operating Expense Debt Service 2013 Prosperity Bank Loan 2014 Bond Issuance 2017 Bond Issuance 2019 Refunding Bonds 2019 New Money 2022 New Money Total Debt Service Other Requirements Workers' Compensation Citywide Administrative Support Communications & Technology Mgmt Accrued Payroll Additional Retirement Contribution Operating Reserve CTECC Trunked Radio Allocation Public Works Capital Projects Mgmt Fund Total Other Requirements Total Requirements 21,658,143 20,170,613 (1,487,530) (7.4%) 41,297,716 37,810,666 (3,487,049) (9.2%) SURPLUS (DEFICIT) OF TOTAL AVAILABLE FUNDS OVER TOTAL REQUIREMENTS Note: Columns may not add to totals shown because of rounding 6,423,120 5,862,517 560,603 9.6% 18,011,040 16,801,270 1,209,771 7.2%