20241113-002 Financial Memo — original pdf
Backup

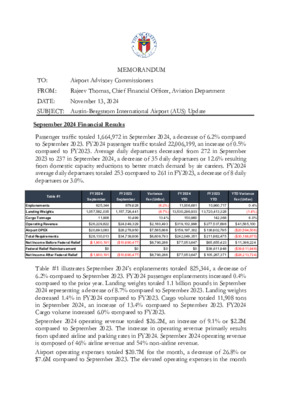
MEMORANDUM TO: Airport Advisory Commissioners FROM: Rajeev Thomas, Chief Financial Officer, Aviation Department DATE: November 13, 2024 SUBJECT: Austin-Bergstrom International Airport (AUS) Update September 2024 Financial Results Passenger traffic totaled 1,664,972 in September 2024, a decrease of 6.2% compared to September 2023. FY2024 passenger traffic totaled 22,006,199, an increase of 0.5% compared to FY2023. Average daily departures decreased from 272 in September 2023 to 237 in September 2024, a decrease of 35 daily departures or 12.6% resulting from domestic capacity reductions to better match demand by air carriers. FY2024 average daily departures totaled 253 compared to 261 in FY2023, a decrease of 8 daily departures or 3.0%. Table #1 FY 2024 FY 2023 Variance September September Fav (Unfav) FY 2024 YTD FY 2023 YTD Variance YTD Fav (Unfav) Enplanements Landing Weights Cargo Tonnage Operating Revenue Airport OPEX Total Requirements 825,344 879,628 (6.2%) 11,006,681 10,960,717 1,057,582,035 1,157,726,441 (8.7%) 13,530,296,933 13,720,413,328 11,908 10,499 13.4% 150,980 142,368 0.4% (1.4%) 6.0% $26,229,822 $24,049,329 $2,180,493 $319,102,998 $277,537,898 $41,565,100 $20,693,083 $28,278,950 $7,585,868 $159,197,302 $138,602,795 ($20,594,506) $28,130,013 $34,739,806 $6,609,793 $242,049,351 $211,882,475 ($30,166,875) Net Income Before Federal Relief ($1,900,191) ($10,690,477) $8,790,286 $77,053,647 $65,655,423 $11,398,224 Federal Relief Reimbursement $0 $0 $0 $0 $39,611,948 ($39,611,948) Net Income After Federal Relief ($1,900,191) ($10,690,477) $8,790,286 $77,053,647 $105,267,371 ($28,213,724) Table #1 illustrates September 2024’s enplanements totaled 825,344, a decrease of 6.2% compared to September 2023. FY2024 passenger enplanements increased 0.4% compared to the prior year. Landing weights totaled 1.1 billion pounds in September 2024 representing a decrease of 8.7% compared to September 2023. Landing weights decreased 1.4% in FY2024 compared to FY2023. Cargo volume totaled 11,908 tons in September 2024, an increase of 13.4% compared to September 2023. FY2024 Cargo volume increased 6.0% compared to FY2023. September 2024 operating revenue totaled $26.2M, an increase of 9.1% or $2.2M compared to September 2023. The increase in operating revenue primarily results from updated airline and parking rates in FY2024. September 2024 operating revenue is composed of 46% airline revenue and 54% non-airline revenue. Airport operating expenses totaled $20.7M for the month, a decrease of 26.8% or $7.6M compared to September 2023. The elevated operating expenses in the month of September compared to earlier months in the fiscal year is primarily the result of year end expenses charged in the final month of the fiscal year, remaining encumbrance balances not yet posted charging in full in the month, and health insurance sweep. The decrease in expenses compared to September 2024 is due to a decrease in the number of pay periods in the month of September (3 in 2023 and 2 in 2024), decreased year end insurance sweep due to improved staffing throughout FY2024, and improved management of outstanding encumbrance balances. Debt service funded by operating revenue decreased 5.0% or $0.3M in September 2024 compared to the prior year because of the application of interest earned on the 2014 bond issuance, and 2017 bond issuance. Because of the elevated expenses in the month of September, AUS reported a $1.9M deficit in September 2024; however, this represents an improvement of $8.8M or 82.2% compared to September 2023. Fiscal Year 2024 Financial Results FY2024 Year to Date (YTD) Operating Revenue totals $319.1M compared to $277.5M in FY2023, a 15.0% increase. Airport Operating Expenses totaled $159.2M YTD in FY2024 compared to $138.6M in FY2023, a 14.9% increase. Net income before federal relief funding totals $77.1M YTD in FY2024 compared to $65.7M in FY2023, a 17.4% increase. Table #2 Approved Budget - Seasonalized CYE - Seasonalized FY 2024 FY 2024 FY 2024 Budget vs. YTD Variance Budget vs. YTD Variance CYE vs. YTD Variance CYE vs. YTD Variance YTD $ Fav (Unfav) % Fav (Unfav) $ Fav (Unfav) $ Fav (Unfav) Operating Revenue Airport OPEX Total Requirements Net Income $299,291,096 $317,033,111 $319,102,998 $19,811,902 $162,360,001 $161,070,508 $159,197,302 $3,162,699 $250,805,697 $249,298,562 $242,049,351 $8,756,346 6.6% 1.9% 3.5% $2,069,887 $1,873,206 $7,249,211 $48,485,399 $67,734,549 $77,053,647 $28,568,248 58.9% $9,319,098 0.7% 1.2% 2.9% 13.8% AUS delivered favorable YTD financial performance compared to FY2024 amended budget and current year estimate (CYE) on a seasonalized basis due to increased operating revenues and expense savings. As presented in Table #2, FY2024 revenues exceed budgeted revenues by 6.6% or $19.8M and exceed CYE by 0.7% or $2.1M. Airport operating expenses are 1.9% or $3.2M below seasonalized budget and 1.2% or $1.9M below seasonalized CYE. AUS reports net income of $77.1M, which exceeds the seasonalized budget estimate by 58.9% or $28.6M and exceeds CYE by 13.8% or $9.3M. Attachments: September 2024 - AAC Financial Report