20240313-002 Financial Report — original pdf
Backup
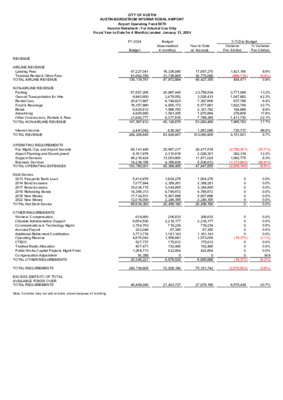
CITY OF AUSTIN AUSTIN-BERGSTROM INTERNATIONAL AIRPORT Airport Operating Fund 5070 Income Statement - For Internal Use Only Fiscal Year to Date for 4 Month(s) ended January 31, 2024 FY 2024 Budget Budget Seasonalized 4 month(s) Year to Date w/ Accruals Variance Fav (Unfav) % Variance Fav (Unfav) Y-T-D to Budget 0 8 REVENUE AIRLINE REVENUE Landing Fees Terminal Rental & Other Fees TOTAL AIRLINE REVENUE NON-AIRLINE REVENUE Parking Ground Transportation for Hire Rental Cars Food & Beverage Retail Advertising Other Concessions, Rentals & Fees TOTAL NON-AIRLINE REVENUE Interest Income TOTAL REVENUE OPERATING REQUIREMENTS Fac Mgmt, Ops and Airport Security Airport Planning and Development Support Services Business Services 2013 Prosperity Bank Loan 2014 Bond Issuance 2017 Bond Issuance 2019 Refunding Bonds 2019 New Money 2022 New Money TOTAL Net Debt Service OTHER REQUIREMENTS Workers' Compensation Citywide Administrative Support Communications & Technology Mgmt Accrued Payroll Additional Retirement Contribution Operating Reserve CTECC Trunked Radio Allocation Public Works Capital Projects Mgmt Fund Compensation Adjustment TOTAL OTHER REQUIREMENTS TOTAL OPERATING EXPENSES Debt Service 47,227,041 91,892,750 139,119,791 67,567,206 8,940,600 20,911,887 16,357,880 6,920,612 4,906,850 21,992,777 147,597,812 2,491,042 289,208,645 85,141,445 8,161,976 46,218,424 14,238,156 153,760,001 5,414,978 7,077,844 10,034,715 14,366,313 17,724,531 12,016,000 66,634,383 619,900 6,654,530 2,154,703 202,049 3,773,716 4,670,043 527,737 457,471 1,268,713 16,359 20,345,221 16,236,080 31,736,805 47,972,884 20,987,445 2,478,552 6,749,823 4,955,172 1,986,793 1,591,255 6,377,635 45,126,676 830,347 93,929,907 25,667,217 2,310,619 13,053,800 4,356,830 45,388,465 1,804,278 2,359,281 3,344,905 4,795,672 5,907,698 2,246,355 20,458,190 206,633 2,218,177 718,234 67,350 1,161,143 1,556,681 175,912 152,490 422,904 0 6,679,525 17,657,270 30,770,085 48,427,355 23,758,534 3,526,433 7,387,609 6,577,881 2,181,782 1,870,864 7,789,365 53,092,468 1,561,085 103,080,908 28,417,518 2,028,301 11,971,024 5,530,812 47,947,655 1,804,278 2,359,281 3,344,905 4,795,672 5,907,698 2,246,355 20,458,190 206,633 2,218,177 718,234 67,350 1,161,143 1,573,054 175,912 152,490 422,904 0 6,695,898 (2,750,301) 282,318 1,082,775 (1,173,982) (2,559,190) (10.7%) 12.2% 8.3% (26.9%) (5.6%) 1,421,190 (966,719) 454,471 2,771,089 1,047,882 637,786 1,622,709 194,988 279,609 1,411,730 7,965,793 730,737 9,151,001 0 0 0 0 0 0 0 0 0 0 0 0 (16,373) 0 0 0 0 (16,373) 8.8% (3.0%) 0.9% 13.2% 42.3% 9.4% 32.7% 9.8% 17.6% 22.1% 17.7% 88.0% 9.7% 0.0% 0.0% 0.0% 0.0% 0.0% 0.0% 0.0% 0.0% 0.0% 0.0% 0.0% 0.0% (1.1%) 0.0% 0.0% 0.0% N/A (0.2%) TOTAL REQUIREMENTS 240,739,605 72,526,180 75,101,742 (2,575,562) (3.6%) EXCESS (DEFICIT) OF TOTAL AVAILABLE FUNDS OVER TOTAL REQUIREMENTS Note: Columns may not add to totals shown because of rounding 48,469,040 21,403,727 27,979,166 6,575,438 30.7% CITY OF AUSTIN AUSTIN-BERGSTROM INTERNATIONAL AIRPORT INCOME STATEMENT COMPARISON THIS YEAR VS. LAST YEAR This month - This Year vs. Last Year FY24 (Jan 24) vs FY23 (Jan 23) Fiscal YTD - This Year vs. Last Year FY24 (Oct 23 - Jan 24) vs FY23 (Oct 22 - Jan 23) FY24 Jan-24 FY23 Jan-23 Fav (Unfav) $ Variance Fav (Unfav) % Variance 3,857,062 7,757,837 11,614,899 3,768,653 5,980,322 9,748,975 88,409 1,777,516 1,865,924 5,286,084 746,948 1,516,146 1,422,189 436,975 311,328 1,892,349 11,612,020 4,809,530 668,758 1,463,636 1,257,896 479,272 254,267 1,686,705 10,620,064 476,553 78,190 52,511 164,294 (42,297) 57,061 205,644 991,956 372,367 23,599,287 246,622 20,615,661 125,746 2,983,626 2.3% 29.7% 19.1% 9.9% 11.7% 3.6% 13.1% (8.8%) 22.4% 12.2% 9.3% 51.0% 14.5% 7,075,924 446,425 3,029,254 1,388,344 11,939,946 451,338 589,820 836,226 1,196,331 1,477,104 561,589 5,112,408 51,658 554,544 179,559 16,837 290,286 393,263 43,978 38,123 105,726 1,673,975 5,067,993 494,906 2,392,971 1,097,387 9,053,257 450,623 589,820 836,226 1,203,298 1,476,625 9,694 4,566,287 38,955 555,489 144,843 15,996 0 379,949 38,755 37,730 131,326 1,343,043 (2,007,930) 48,481 (636,282) (290,957) (2,886,689) (39.6%) 9.8% (26.6%) (26.5%) (31.9%) (715) 0 0 6,967 (479) (551,894) (546,121) (12,704) 945 (34,715) (842) (290,286) (13,314) (5,223) (392) 25,600 (330,931) (0.2%) 0.0% 0.0% 0.6% (0.0%) (5693.0%) (12.0%) (32.6%) 0.2% (24.0%) (5.3%) N/A (3.5%) (13.5%) (1.0%) 19.5% (24.6%) FY24 YTD Jan-24 17,657,270 30,770,085 48,427,355 23,758,534 3,526,433 7,387,609 6,577,881 2,181,782 1,870,864 7,789,365 53,092,468 1,561,085 103,080,908 28,417,518 2,028,301 11,971,024 5,530,812 47,947,655 1,804,278 2,359,281 3,344,905 4,795,672 5,907,698 2,246,355 20,458,190 206,633 2,218,177 718,234 67,350 1,161,143 1,573,054 175,912 152,490 422,904 6,695,898 FY23 YTD Jan-23 Fav (Unfav) $ Variance Fav (Unfav) % Variance 15,393,873 24,151,332 39,545,205 21,181,089 3,170,150 7,259,108 5,809,689 2,363,058 1,782,472 6,546,316 48,111,882 807,770 88,464,857 20,561,522 2,163,563 9,459,211 4,154,478 36,338,774 1,803,014 2,359,281 3,344,905 4,822,297 5,905,594 38,535 18,273,626 155,818 2,221,956 579,373 63,982 0 1,519,796 155,020 150,921 525,306 5,372,172 2,263,397 6,618,753 8,882,150 2,577,445 356,283 128,500 768,193 (181,276) 88,392 1,243,049 4,980,587 753,314 14,616,051 14.7% 27.4% 22.5% 12.2% 11.2% 1.8% 13.2% (7.7%) 5.0% 19.0% 10.4% 93.3% 16.5% (7,855,995) 135,262 (2,511,813) (1,376,334) (11,608,881) (38.2%) 6.3% (26.6%) (33.1%) (31.9%) (1,265) 0 0 26,625 (2,104) (2,207,820) (2,184,564) (50,815) 3,779 (138,861) (3,368) (1,161,143) (53,258) (20,892) (1,569) 102,401 (1,323,726) (0.1%) 0.0% 0.0% 0.6% (0.0%) (5729.4%) (12.0%) (32.6%) 0.2% (24.0%) (5.3%) N/A (3.5%) (13.5%) (1.0%) 19.5% (24.6%) 4,872,958 5,653,073 (780,115) (13.8%) 27,979,166 28,480,284 (501,119) (1.8%) 0 0 0 (1,111,631) (4,556,653) (5,668,284) (1,111,631) (4,556,653) (5,668,284) (100.0%) (100.0%) (100.0%) 0 0 0 (3,429,616) (18,234,448) (21,664,065) (3,429,616) (18,234,448) (21,664,065) (100.0%) (100.0%) (100.0%) Airline Revenue Landing Fees Terminal Rental & Other Fees Total Airline Revenue Non-Airline Revenue Parking Ground Transportation for Hire Rental Cars Food & Beverage Retail Advertising Other Concessions, Rentals & Fees Total Non-Airline Revenue Interest Income Total Operating Revenue Operating Requirements Fac Mgmt, Ops and Airport Security Airport Planning and Development Support Services Business Services Total Operating Expense Debt Service 2013 Prosperity Bank Loan 2014 Bond Issuance 2017 Bond Issuance 2019 Refunding Bonds 2019 New Money 2022 New Money Total Debt Service Other Requirements Workers' Compensation Citywide Administrative Support Communications & Technology Mgmt Accrued Payroll Additional Retirement Contribution Operating Reserve CTECC Trunked Radio Allocation Public Works Capital Projects Mgmt Fund Total Other Requirements SURPLUS (DEFICIT) OF TOTAL AVAILABLE FUNDS OVER TOTAL REQUIREMENTS Federal Relief Reimbursement (Parking) Federal Relief Reimbursement (Debt Service) Total Federal Relief Total Requirements 18,726,328 14,962,587 (3,763,741) (25.2%) 75,101,742 59,984,572 (15,117,170) (25.2%) TOTAL SURPLUS (DEFICIT) AFTER FEDERAL RELIEF 4,872,958 11,321,357 (6,448,399) (57.0%) $ 27,979,166 $ 50,144,349 $ (22,165,183) (44.2%) Note: Columns may not add to totals shown because of rounding