20240313-002 Financial Memo — original pdf
Backup

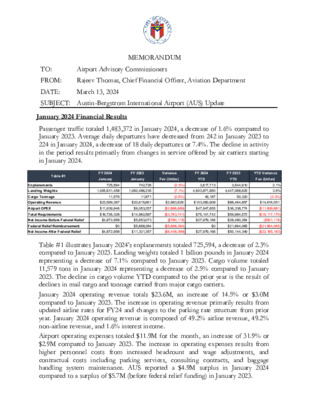
MEMORANDUM TO: Airport Advisory Commissioners FROM: Rajeev Thomas, Chief Financial Officer, Aviation Department SUBJECT: Austin-Bergstrom International Airport (AUS) Update DATE: March 13, 2024 January 2024 Financial Results Passenger traffic totaled 1,483,372 in January 2024, a decrease of 1.6% compared to January 2023. Average daily departures have decreased from 242 in January 2023 to 224 in January 2024, a decrease of 18 daily departures or 7.4%. The decline in activity in the period results primarily from changes in service offered by air carriers starting in January 2024. Table #1 FY 2024 January FY 2023 January Variance Fav (Unfav) FY 2024 YTD FY 2023 YTD Variance YTD Fav (Unfav) Enplanements Landing Weights Cargo Tonnage Operating Revenue Airport OPEX Total Requirements Net Income Before Federal Relief Federal Relief Reimbursement 725,594 742,726 (2.3%) 3,617,713 3,544,910 1,005,631,458 1,082,486,235 (7.1%) 4,603,871,850 4,447,068,625 11,579 11,871 (2.5%) 49,187 50,320 2.1% 3.5% (2.3%) $23,599,287 $11,939,946 $18,726,328 $4,872,958 $0 $20,615,661 $2,983,626 $103,080,908 $88,464,857 $14,616,051 $9,053,257 ($2,886,689) $47,947,655 $36,338,774 ($11,608,881) $14,962,587 ($3,763,741) $75,101,742 $59,984,572 ($15,117,170) ($780,115) $27,979,166 $28,480,284 ($501,119) ($5,668,284) $0 $21,664,065 ($21,664,065) Net Income After Federal Relief $4,872,958 $11,321,357 ($6,448,399) $27,979,166 $50,144,349 ($22,165,183) $5,653,073 $5,668,284 Table #1 illustrates January 2024’s enplanements totaled 725,594, a decrease of 2.3% compared to January 2023. Landing weights totaled 1 billion pounds in January 2024 representing a decrease of 7.1% compared to January 2023. Cargo volume totaled 11,579 tons in January 2024 representing a decrease of 2.5% compared to January 2023. The decline in cargo volume YTD compared to the prior year is the result of declines in mail cargo and tonnage carried from major cargo carriers. January 2024 operating revenue totals $23.6M, an increase of 14.5% or $3.0M compared to January 2023. The increase in operating revenue primarily results from updated airline rates for FY24 and changes to the parking rate structure from prior year. January 2024 operating revenue is composed of 49.2% airline revenue, 49.2% non-airline revenue, and 1.6% interest income. Airport operating expenses totaled $11.9M for the month, an increase of 31.9% or $2.9M compared to January 2023. The increase in operating expenses results from higher personnel costs from increased headcount and wage adjustments, and contractual costs including parking services, consulting contracts, and baggage handling system maintenance. AUS reported a $4.9M surplus in January 2024 compared to a surplus of $5.7M (before federal relief funding) in January 2023. Fiscal Year 2024 Financial Results FY2024 Year to Date (YTD) Operating Revenue totals $103.1M compared to $88.5M in FY2023, a 16.5% increase. Airport Operating Expenses totaled $47.9M YTD in FY2024 compared to $36.3M in FY2023, a 31.9% increase. Net income before federal relief funding totals $28.0M YTD in FY2024 compared to $28.5M in FY2023, a 1.8% decrease. FY 2024 FY 2024 Budget vs. YTD Variance Budget vs. YTD Variance YTD $ Fav (Unfav) % Fav (Unfav) Table #2 Approved Budget - Seasonalized $93,929,907 Operating Revenue Airport OPEX Total Requirements Net Income Before Debt Service Net Income Before Federal Relief Federal Relief Reimbursement $103,080,908 $9,151,001 $45,388,465 $72,526,180 $41,861,917 $21,403,727 $0 $47,947,655 $75,101,742 $48,437,355 $27,979,166 $0 ($2,559,190) ($2,575,562) $6,575,438 $6,575,438 $0 Net Income After Federal Relief $21,403,727 $27,979,166 $6,575,438 9.7% (5.6%) (3.6%) 15.7% 30.7% 0.0% 30.7% Through January 2024, AUS delivered favorable YTD financial performance compared to FY2024 budget on a seasonalized basis due to increased operating revenues. As presented in Table #2, FY2024 revenues exceed budgeted revenues by 9.7% or $9.2M. Airport operating expenses are 5.6% or $2.6M above seasonalized budgeted expenses due to higher personnel costs from faster than anticipated filling of vacant positions, increased overtime worked during periods of high passenger traffic, and increased parking operations cost. Before federal relief, AUS reports net income of $28.0M, which exceeds the seasonalized budget estimate by 30.7% or $6.6M. Attachments: January 2024 - AAC Financial Report