20240214-002 Financial Report — original pdf
Backup
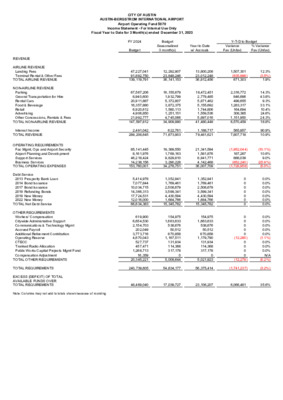
CITY OF AUSTIN AUSTIN-BERGSTROM INTERNATIONAL AIRPORT Airport Operating Fund 5070 Income Statement - For Internal Use Only Fiscal Year to Date for 3 Month(s) ended December 31, 2023 FY 2024 Budget Budget Seasonalized 3 month(s) Year to Date w/ Accruals Variance Fav (Unfav) % Variance Fav (Unfav) Y-T-D to Budget 0 6 REVENUE AIRLINE REVENUE Landing Fees Terminal Rental & Other Fees TOTAL AIRLINE REVENUE NON-AIRLINE REVENUE Parking Ground Transportation for Hire Rental Cars Food & Beverage Retail Advertising Other Concessions, Rentals & Fees TOTAL NON-AIRLINE REVENUE Interest Income TOTAL REVENUE OPERATING REQUIREMENTS Fac Mgmt, Ops and Airport Security Airport Planning and Development Support Services Business Services 2013 Prosperity Bank Loan 2014 Bond Issuance 2017 Bond Issuance 2019 Refunding Bonds 2019 New Money 2022 New Money TOTAL Net Debt Service OTHER REQUIREMENTS Workers' Compensation Citywide Administrative Support Communications & Technology Mgmt Accrued Payroll Additional Retirement Contribution Operating Reserve CTECC Trunked Radio Allocation Public Works Capital Projects Mgmt Fund Compensation Adjustment TOTAL OTHER REQUIREMENTS TOTAL OPERATING EXPENSES Debt Service 47,227,041 91,892,750 139,119,791 67,567,206 8,940,600 20,911,887 16,357,880 6,920,612 4,906,850 21,992,777 147,597,812 2,491,042 289,208,645 85,141,445 8,161,976 46,218,424 14,238,156 153,760,001 5,414,978 7,077,844 10,034,715 14,366,313 17,724,531 12,016,000 66,634,383 619,900 6,654,530 2,154,703 202,049 3,773,716 4,670,043 527,737 457,471 1,268,713 16,359 20,345,221 12,292,907 23,848,246 36,141,153 16,155,679 1,932,799 5,372,807 3,872,375 1,580,113 1,251,151 4,745,066 34,909,990 622,761 71,673,903 19,389,550 1,769,163 9,829,810 3,290,228 34,278,751 1,352,941 1,769,461 2,508,679 3,599,341 4,430,594 1,684,766 15,345,782 154,975 1,663,633 538,676 50,512 870,858 1,167,511 131,934 114,368 317,178 0 5,009,644 13,800,208 23,012,248 36,812,456 18,472,451 2,779,485 5,871,462 5,155,692 1,744,806 1,559,536 5,897,016 41,480,449 1,188,717 79,481,621 21,341,594 1,581,876 8,941,771 4,142,468 36,007,709 1,352,941 1,769,461 2,508,679 3,599,341 4,430,594 1,684,766 15,345,782 154,975 1,663,633 538,676 50,512 870,858 1,179,790 131,934 114,368 317,178 0 5,021,923 (1,952,044) 187,287 888,039 (852,240) (1,728,958) (10.1%) 10.6% 9.0% (25.9%) (5.0%) 1,507,301 (835,998) 671,303 2,316,772 846,686 498,655 1,283,317 164,694 308,385 1,151,950 6,570,459 565,957 7,807,718 0 0 0 0 0 0 0 0 0 0 0 0 (12,280) 0 0 0 0 (12,279) 12.3% (3.5%) 1.9% 14.3% 43.8% 9.3% 33.1% 10.4% 24.6% 24.3% 18.8% 90.9% 10.9% 0.0% 0.0% 0.0% 0.0% 0.0% 0.0% 0.0% 0.0% 0.0% 0.0% 0.0% 0.0% (1.1%) 0.0% 0.0% 0.0% N/A (0.2%) TOTAL REQUIREMENTS 240,739,605 54,634,177 56,375,414 (1,741,237) (3.2%) EXCESS (DEFICIT) OF TOTAL AVAILABLE FUNDS OVER TOTAL REQUIREMENTS Note: Columns may not add to totals shown because of rounding 48,469,040 17,039,727 23,106,207 6,066,481 35.6% CITY OF AUSTIN AUSTIN-BERGSTROM INTERNATIONAL AIRPORT INCOME STATEMENT COMPARISON THIS YEAR VS. LAST YEAR This month - This Year vs. Last Year FY24 (Dec 23) vs FY23 (Dec 22) Fiscal YTD - This Year vs. Last Year FY24 (Oct 23 - Dec 23) vs FY23 (Oct 22 - Dec 22) FY24 Dec-23 FY23 Dec-22 Fav (Unfav) $ Variance Fav (Unfav) % Variance FY24 YTD Dec-23 FY23 YTD Dec-22 Fav (Unfav) $ Variance Fav (Unfav) % Variance 4,474,751 7,555,187 12,029,939 3,697,737 5,729,946 9,427,682 777,015 1,825,242 2,602,256 5,756,718 785,393 1,553,554 1,615,019 483,699 413,924 1,919,729 12,528,035 5,148,339 711,275 1,577,200 1,477,593 555,279 442,192 1,719,897 11,631,776 608,378 74,118 (23,647) 137,426 (71,580) (28,268) 199,832 896,259 311,712 24,869,685 162,541 21,221,998 149,171 3,647,687 6,826,386 466,420 3,125,381 1,360,178 11,778,365 6,133,065 612,697 2,773,993 1,097,941 10,617,696 (693,321) 146,277 (351,388) (262,236) (1,160,669) 21.0% 31.9% 27.6% 11.8% 10.4% (1.5%) 9.3% (12.9%) (6.4%) 11.6% 7.7% 91.8% 17.2% (11.3%) 23.9% (12.7%) (23.9%) (10.9%) 451,338 589,820 836,226 1,196,331 1,477,104 561,589 5,112,408 51,658 554,544 179,559 16,837 290,286 393,263 43,978 38,123 105,726 1,673,975 450,623 589,820 836,226 1,203,298 1,476,625 9,694 4,566,287 38,955 555,489 144,843 15,996 0 379,949 38,755 37,730 131,326 1,343,043 (715) 0 0 6,967 (479) (551,894) (546,121) (12,704) 945 (34,715) (842) (290,286) (13,314) (5,223) (392) 25,600 (330,931) (0.2%) 0.0% 0.0% 0.6% (0.0%) (5693.0%) (12.0%) (32.6%) 0.2% (24.0%) (5.3%) N/A (3.5%) (13.5%) (1.0%) 19.5% (24.6%) 13,800,208 23,012,248 36,812,456 18,472,451 2,779,485 5,871,462 5,155,692 1,744,806 1,559,536 5,897,016 41,480,449 1,188,717 79,481,621 21,341,594 1,581,876 8,941,771 4,142,468 36,007,709 1,352,941 1,769,461 2,508,679 3,599,341 4,430,594 1,684,766 15,345,782 154,975 1,663,633 538,676 50,512 870,858 1,179,790 131,934 114,368 317,178 5,021,923 11,625,219 18,171,010 29,796,230 16,371,559 2,501,392 5,795,473 4,551,793 1,883,786 1,528,205 4,859,610 37,491,817 561,149 67,849,196 15,493,529 1,668,657 7,066,240 3,057,091 27,285,517 1,352,391 1,769,461 2,508,679 3,618,999 4,428,969 28,841 13,707,339 116,864 1,666,467 434,530 47,987 0 1,139,847 116,265 113,191 393,979 4,029,129 627,569 11,632,425 111.8% 17.1% 2,174,989 4,841,237 7,016,226 2,100,892 278,093 75,990 603,899 (138,980) 31,331 1,037,406 3,988,631 (5,848,065) 86,781 (1,875,531) (1,085,377) (8,722,192) (550) 0 0 19,658 (1,625) (1,655,926) (1,638,443) (38,111) 2,834 (104,146) (2,526) (870,858) (39,943) (15,669) (1,177) 76,801 (992,794) 18.7% 26.6% 23.5% 12.8% 11.1% 1.3% 13.3% (7.4%) 2.1% 21.3% 10.6% (37.7%) 5.2% (26.5%) (35.5%) (32.0%) (0.0%) 0.0% 0.0% 0.5% (0.0%) (5741.6%) (12.0%) (32.6%) 0.2% (24.0%) (5.3%) N/A (3.5%) (13.5%) (1.0%) 19.5% (24.6%) 6,304,938 4,694,972 1,609,966 34.3% 23,106,207 22,827,211 278,996 1.2% 0 0 0 (831,789) (13,677,796) (14,509,585) (831,789) (13,677,796) (14,509,585) (100.0%) (100.0%) (100.0%) 0 0 0 (2,317,985) (13,677,796) (15,995,781) (2,317,985) (13,677,796) (15,995,781) (100.0%) (100.0%) (100.0%) Airline Revenue Landing Fees Terminal Rental & Other Fees Total Airline Revenue Non-Airline Revenue Parking Ground Transportation for Hire Rental Cars Food & Beverage Retail Advertising Other Concessions, Rentals & Fees Total Non-Airline Revenue Interest Income Total Operating Revenue Operating Requirements Fac Mgmt, Ops and Airport Security Airport Planning and Development Support Services Business Services Total Operating Expense Debt Service 2013 Prosperity Bank Loan 2014 Bond Issuance 2017 Bond Issuance 2019 Refunding Bonds 2019 New Money 2022 New Money Total Debt Service Other Requirements Workers' Compensation Citywide Administrative Support Communications & Technology Mgmt Accrued Payroll Additional Retirement Contribution Operating Reserve CTECC Trunked Radio Allocation Public Works Capital Projects Mgmt Fund Total Other Requirements SURPLUS (DEFICIT) OF TOTAL AVAILABLE FUNDS OVER TOTAL REQUIREMENTS Federal Relief Reimbursement (Parking) Federal Relief Reimbursement (Debt Service) Total Federal Relief Total Requirements 18,564,748 16,527,026 (2,037,721) (12.3%) 56,375,414 45,021,985 (11,353,429) (25.2%) TOTAL SURPLUS (DEFICIT) AFTER FEDERAL RELIEF 6,304,938 19,204,557 (12,899,619) (67.2%) $ 23,106,207 $ 38,822,992 $ (15,716,785) (40.5%) Note: Columns may not add to totals shown because of rounding