June 2021 Financial Report — original pdf
Backup
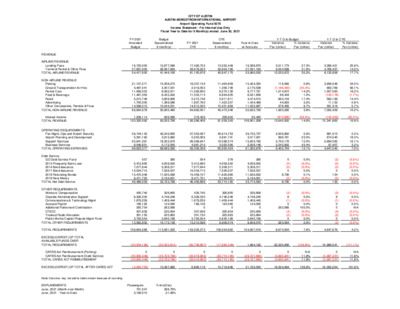
CITY OF AUSTIN AUSTIN-BERGSTROM INTERNATIONAL AIRPORT Airport Operating Fund 5070 Income Statement - For Internal Use Only Fiscal Year to Date for 9 Month(s) ended June 30, 2021 FY 2021 Amended Budget Budget Seasonalized 9 month(s) FY 2021 CYE CYE Seasonalized 9 month(s) Year to Date w/ Accruals Variance Fav (Unfav) % Variance Fav (Unfav) Variance Fav (Unfav) % Variance Fav (Unfav) Y-T-D to Budget Y-T-D to CYE 95,420 106,901,208 (810,666) 13,645,502 (143,402) 15,341,865 (60.0%) 16.8% 16,720,000 37,697,000 54,417,000 21,107,271 4,487,041 11,069,553 11,467,350 5,215,748 1,750,000 14,598,015 69,694,978 1,208,114 125,320,092 59,744,143 5,391,192 25,641,391 8,046,651 98,823,377 507 5,412,895 7,077,844 10,034,715 15,470,348 8,471,750 46,468,059 435,740 6,328,330 1,879,259 166,126 350,754 307,939 301,150 3,793,554 13,562,852 12,877,096 28,567,064 41,444,160 15,308,273 3,357,031 8,562,911 8,433,222 3,809,906 1,389,586 10,044,531 50,905,460 906,086 93,255,706 42,243,600 3,915,962 18,353,970 5,172,050 69,685,582 380 4,059,502 5,308,311 7,526,037 11,635,568 5,194,001 33,723,799 326,805 4,746,248 1,409,444 124,595 263,066 230,954 225,863 2,845,166 10,172,139 17,426,753 43,679,223 61,105,976 18,337,134 2,019,053 11,026,850 11,553,113 5,215,748 1,897,783 14,812,320 64,862,001 318,429 126,286,406 57,553,087 5,053,065 26,068,947 4,681,210 93,356,309 504 5,412,895 7,077,844 10,034,715 15,459,157 8,471,751 46,456,866 435,740 6,328,330 1,879,259 166,126 0 307,939 301,150 3,793,554 13,212,098 13,022,449 32,824,726 45,847,175 11,464,809 1,306,748 8,270,138 8,664,835 3,911,811 1,423,337 10,431,669 45,473,346 238,822 91,559,343 40,614,753 3,691,741 18,598,374 3,025,556 65,930,424 378 4,059,502 5,308,311 7,526,037 11,626,966 5,194,001 33,715,195 326,805 4,746,248 1,409,444 124,595 0 230,954 225,863 2,845,166 9,909,074 16,388,870 37,591,163 53,980,032 15,424,355 2,170,538 9,777,721 8,521,656 4,474,010 1,434,489 11,022,987 52,825,756 39,733,737 3,017,201 15,603,792 2,928,148 61,282,878 380 4,059,502 5,308,311 7,526,037 11,626,832 5,194,001 33,715,063 326,808 4,746,240 1,409,445 124,595 0 230,958 225,864 2,845,166 9,909,075 3,511,773 9,024,099 12,535,872 116,082 (1,186,493) 1,214,810 88,434 664,104 44,903 978,456 1,920,295 2,509,862 898,761 2,750,178 2,243,902 8,402,704 0 (0) (0) 0 8,736 (0) 8,736 (3) 8 (1) 0 263,066 (4) (2) 0 263,064 27.3% 31.6% 30.2% 0.8% (35.3%) 14.2% 1.0% 17.4% 3.2% 9.7% 3.8% (89.5%) 14.6% 5.9% 23.0% 15.0% 43.4% 12.1% 0.0% (0.0%) (0.0%) 0.0% 0.1% (0.0%) 0.0% (0.0%) 0.0% (0.0%) 0.0% 100.0% (0.0%) (0.0%) 0.0% 2.6% 3,366,421 4,766,437 8,132,858 3,959,546 863,789 1,507,583 (143,178) 562,199 11,152 591,318 7,352,409 881,015 674,540 2,994,582 97,407 4,647,545 (2) (0) (0) 0 134 (0) 132 (3) 8 (1) 0 0 (4) (2) 0 (2) 25.9% 14.5% 17.7% 34.5% 66.1% 18.2% (1.7%) 14.4% 0.8% 5.7% 16.2% 2.2% 18.3% 16.1% 3.2% 7.0% (0.6%) (0.0%) (0.0%) 0.0% 0.0% (0.0%) 0.0% (0.0%) 0.0% (0.0%) 0.0% N/A (0.0%) (0.0%) 0.0% (0.0%) 1 REVENUE AIRLINE REVENUE Landing Fees Terminal Rental & Other Fees TOTAL AIRLINE REVENUE NON-AIRLINE REVENUE Parking Ground Transportation for Hire Rental Cars Food & Beverage Retail Advertising Other Concessions, Rentals & Fees TOTAL NON-AIRLINE REVENUE Interest Income TOTAL REVENUE OPERATING REQUIREMENTS Fac Mgmt, Ops and Airport Security Airport Planning and Development Support Services Business Services GO Debt Service Fund 2013 Prosperity Bank Loan 2014 Bond Issuance 2017 Bond Issuance 2019 Refunding Bonds 2019 New Money TOTAL Net Debt Service OTHER REQUIREMENTS Workers' Compensation Citywide Administrative Support Communications & Technology Mgmt Accrued Payroll Additional Retirement Contribution CTECC Trunked Radio Allocation Public Works Capital Projects Mgmt Fund TOTAL OTHER REQUIREMENTS EXCESS (DEFICIT) OF TOTAL AVAILABLE FUNDS OVER TOTAL REQUIREMENTS TOTAL OPERATING EXPENSES Debt Service TOTAL REQUIREMENTS 158,854,288 113,581,520 153,025,273 109,554,692 104,907,016 8,674,504 7.6% 4,647,676 4.2% CARES Act Reimbursement (Parking) CARES Act Reimbursement (Debt Service) TOTAL CARES ACT REIMBURSEMENT 0 (30,950,446) (30,950,446) 0 (33,723,799) (33,723,799) 0 (33,618,983) (33,618,983) 0 (33,715,195) (33,715,195) 0 (29,727,858) (29,727,858) 0 (3,995,941) (3,995,941) N/A 11.8% 11.8% 0 (3,987,337) (3,987,337) N/A 11.8% 11.8% EXCESS (DEFICIT) OF TOTAL AFTER CARES ACT (2,583,750) 13,397,985 6,880,116 15,719,846 31,722,050 18,324,064 136.8% 16,002,204 101.8% (33,534,196) (20,325,814) (26,738,867) (17,995,349) 1,994,192 22,320,006 (109.8%) 19,989,541 (111.1%) Note: Columns may not add to totals shown because of rounding ENPLANEMENTS June, 2021 (Month over Month) June, 2021 - Year-to-Date Passengers % Inc/(Dec) 701,047 3,199,010 366.76% -21.99% CITY OF AUSTIN AUSTIN-BERGSTROM INTERNATIONAL AIRPORT INCOME STATEMENT COMPARISON THIS YEAR VS. LAST YEAR This month - This Year vs. Last Year FY21 (Jun 21) vs FY20 (Jun 20) Fiscal YTD - This Year vs. Last Year FY21 (Oct 20 - Jun 21) vs FY20 (Oct 19 - Jun 20) FY21 Jun-21 FY20 Jun-20 Fav (Unfav) $ Variance Fav (Unfav) % Variance FY21 YTD Jun-21 FY20 YTD Jun-20 Fav (Unfav) $ Variance Fav (Unfav) % Variance 2,802,662 4,850,229 7,652,890 3,108,426 450,601 1,501,840 1,067,803 538,049 165,128 1,374,989 8,206,836 4,669 15,864,396 3,989,363 309,557 1,688,054 428,935 6,415,909 42 451,131 589,844 836,226 1,277,299 1,092,583 4,247,127 36,312 527,360 156,605 13,844 0 0 0 25,662 25,096 316,130 1,101,008 1,018,891 3,606,759 4,625,650 668,060 73,708 1,055,507 148,129 89,614 111,511 1,083,353 3,229,881 30,588 7,886,118 3,928,122 307,841 1,729,663 405,293 6,370,920 0 450,700 589,827 836,229 1,401,081 474,000 3,751,837 38,282 479,138 151,494 29,543 0 0 0 17,126 26,436 283,281 1,025,300 1,783,771 1,243,470 3,027,241 2,440,366 376,893 446,333 919,675 448,435 53,617 291,637 4,976,955 (25,919) 7,978,277 (61,241) (1,715) 41,608 (23,641) (44,989) (42) (431) (17) 3 123,782 (618,583) (495,289) 1,970 (48,222) (5,111) 15,699 0 0 0 (8,536) 1,340 (32,849) (75,709) 175.1% 34.5% 65.4% 365.3% 511.3% 42.3% 620.9% 500.4% 48.1% 26.9% 154.1% (84.7%) 101.2% (1.6%) (0.6%) 2.4% (5.8%) (0.7%) N/A (0.1%) (0.0%) 0.0% 8.8% (130.5%) (13.2%) 5.1% (10.1%) (3.4%) 53.1% N/A N/A N/A (49.8%) 5.1% (11.6%) (7.4%) 95,420 106,901,208 737,369 115,182,458 16,388,870 37,591,163 53,980,032 15,424,355 2,170,538 9,777,721 8,521,656 4,474,010 1,434,489 11,022,987 52,825,756 39,733,737 3,017,201 15,603,792 2,928,148 61,282,878 380 4,059,502 5,308,311 7,526,037 11,626,832 5,194,001 33,715,063 326,808 4,746,240 1,409,445 124,595 0 0 0 230,958 225,864 2,845,166 9,909,075 19,731,738 37,919,733 57,651,471 20,073,793 3,563,067 10,847,778 6,286,893 2,782,796 1,751,655 11,487,638 56,793,619 43,453,056 4,588,581 18,152,285 9,263,314 75,457,235 0 4,057,100 5,308,300 7,453,769 11,846,423 2,904,600 31,570,192 344,538 4,312,242 1,363,446 265,883 0 0 0 154,134 237,924 2,549,529 9,227,696 (3,342,868) (328,570) (3,671,438) (4,649,438) (1,392,529) (1,070,057) 2,234,764 1,691,215 (317,166) (464,651) (3,967,863) (641,949) (8,281,251) 3,719,318 1,571,380 2,548,493 6,335,166 14,174,357 (380) (2,402) (11) (72,267) 219,591 (2,289,401) (2,144,871) 17,730 (433,998) (45,999) 141,289 0 0 0 (76,824) 12,060 (295,637) (681,379) (16.9%) (0.9%) (6.4%) (23.2%) (39.1%) (9.9%) 35.5% 60.8% (18.1%) (4.0%) (7.0%) (87.1%) (7.2%) 8.6% 34.2% 14.0% 68.4% 18.8% N/A (0.1%) (0.0%) (1.0%) 1.9% (78.8%) (6.8%) 5.1% (10.1%) (3.4%) 53.1% N/A N/A N/A (49.8%) 5.1% (11.6%) (7.4%) 4,100,352 (3,261,939) 7,362,290 (225.7%) 1,994,192 (1,072,665) 3,066,857 (285.9%) 0 (253,635) (253,635) (1,743,588) (3,647,210) (5,390,798) (1,743,588) (3,393,575) (5,137,163) 1.00 0.93 95.3% 0 (29,727,858) (29,727,858) (1,743,588) (3,647,210) (5,390,798) (1,743,588) 26,080,648 24,337,060 1.00 (7.15) (451.5%) Airline Revenue Landing Fees Terminal Rental & Other Fees Total Airline Revenue Non-Airline Revenue Parking Ground Transportation for Hire Rental Cars Food & Beverage Retail Advertising Other Concessions, Rentals & Fees Total Non-Airline Revenue Interest Income Total Operating Revenue Operating Requirements Fac Mgmt, Ops and Airport Security Airport Planning and Development Support Services Business Services Total Operating Expense Debt Service GO Debt Service Fund 2013 Prosperity Bank Loan 2014 Bond Issuance 2017 Bond Issuance 2019 Refunding Bonds 2019 New Money Total Debt Service Other Requirements Workers' Compensation Citywide Administrative Support Communications & Technology Mgmt Accrued Payroll 27th Payroll Additional Retirement Contribution Operating Reserve CTECC Trunked Radio Allocation Public Works Capital Projects Mgmt Fund Total Other Requirements SURPLUS (DEFICIT) OF TOTAL AVAILABLE FUNDS OVER TOTAL REQUIREMENTS CARES Act Reimbursement (Parking) CARES Act Reimbursement (Debt Service) Total CARES Act Total Requirements 11,764,044 11,148,057 (615,987) (5.5%) 104,907,016 116,255,123 11,348,107 9.8% TOTAL SURPLUS (DEFICIT) AFTER CARES ACT 4,353,987 (5,005,527) 9,359,514 (187.0%) 31,722,050 $ (2,816,253) $ 34,538,303 (1226.4%) Note: Columns may not add to totals shown because of rounding