Backup — original pdf
Backup

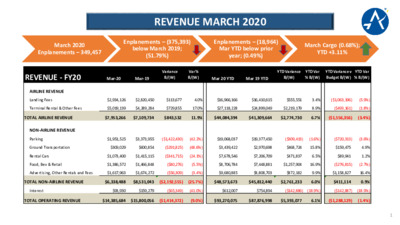
REVENUE MARCH 2020 March 2020 Enplanements – 349,457 Enplanements – (375,393) below March 2019; (51.79%) Enplanements – (18,964) Mar YTD below prior year; (0.49%) March Cargo (0.68%); YTD +3.11% 1 REVENUE - FY20Mar-20Mar-19Variance B/(W)Var % B/(W)Mar 20 YTDMar 19 YTDYTD Variance B/(W)YTD Var % B/(W)YTD Variance v Budget B/(W)YTD Var % B/(W)AIRLINE REVENUELanding Fees$2,934,126$2,820,450$113,6774.0%$16,966,166$16,410,615$555,5513.4%($1,063,196)(5.9%)Terminal Rental & Other Fees$5,019,139$4,289,284$729,85517.0%$27,118,228$24,899,049$2,219,1798.9%($493,161)(1.8%)TOTAL AIRLINE REVENUE$7,953,266$7,109,734$843,53211.9%$44,084,394$41,309,664$2,774,7306.7%($1,556,356)(3.4%)NON-AIRLINE REVENUEParking$1,951,525$3,373,955($1,422,430)(42.2%)$19,068,037$19,377,450($309,413)(1.6%)($720,313)(3.6%)Ground Transportation$309,029$600,854($291,825)(48.6%)$3,439,422$2,970,698$468,72415.8%$159,4754.9%Rental Cars$1,073,400$1,415,115($341,715)(24.1%)$7,678,546$7,206,709$471,8376.5%$89,9411.2%Food, Bev & Retail$1,386,572$1,466,848($80,276)(5.5%)$8,706,784$7,448,881$1,257,90416.9%($276,815)(2.7%)Advertising, Other Rentals and Fees$1,617,963$1,674,272($56,309)(3.4%)$9,680,885$8,808,703$872,1829.9%$1,158,82716.4%TOTAL NON-AIRLINE REVENUE$6,338,488$8,531,043($2,192,555)(25.7%)$48,573,673$45,812,440$2,761,2336.0%$411,1140.9%Interest$93,930$159,279($65,349)(41.0%)$612,007$754,894($142,886)(18.9%)($142,887)(18.9%)TOTAL OPERATING REVENUE$14,385,684$15,800,056($1,414,372)(9.0%)$93,270,075$87,876,998$5,393,0776.1%($1,288,129)(1.4%) OPEX, DEBT & NET INCOME – MARCH 2020 2 EXPENSES & INCOME FY20Mar-20Mar-19Variance B/(W)Var % B/(W)Mar 20 YTDMar 19 YTDYTD Variance B/(W)YTD Var % B/(W)YTD Variance v Budget B/(W)YTD Var % B/(W)OPERATING REQUIREMENTSFac Mgmt, Ops and Airport Security$4,517,113$4,396,030($121,083)(2.8%)$29,366,229$27,055,411($2,310,819)(8.5%)$4,368,29112.9%Airport Planning and Development$603,378$325,960($277,418)(85.1%)$3,083,664$2,041,829($1,041,835)(51.0%)$436,80712.4%Support Services$1,959,261$1,353,765($605,496)(44.7%)$12,324,138$10,024,411($2,299,728)(22.9%)$972,6237.3%Business Services$1,212,029$1,088,773($123,256)(11.3%)$7,528,758$7,283,875($244,884)(3.4%)($1,385,820)(22.6%)TOTAL OPERATING REQ (AIRPORT)$8,291,782$7,164,528($1,127,254)(15.7%)$52,302,790$46,405,525($5,897,265)(12.7%)$4,391,9017.7%OTHER REQUIREMENTS (COA)$1,308,641$1,178,222($130,420)(11.1%)$7,851,848$7,069,357($782,491)(11.1%)$200,6852.5%OPERATING REQ BEFORE DEBT SVC$9,600,423$8,342,749($1,257,674)(15.1%)$60,154,638$53,474,882($6,679,756)(12.5%)$4,592,5867.1%DEBT SERVICE$3,601,881$2,374,390($1,227,492)(51.7%)$20,539,378$13,631,010($6,908,368)(50.7%)($1,706,178)(9.1%)TOTAL OPERATING REQ INCL DEBT SVC$13,202,305$10,717,139($2,485,166)(23.2%)$80,694,015$67,105,892($13,588,123)(20.2%)$2,886,4083.5%OPERATING INCOME BEFORE DEBT SVC$4,785,261$7,457,307($2,672,046)(35.8%)$33,115,437$34,402,116($1,286,679)(3.7%)$3,304,45711.1%SURPLUS (DEFICIT) - NET INCOME$1,183,379$5,082,917($3,899,537)(76.7%)$12,576,059$20,771,106($8,195,047)(39.5%)$1,598,27814.6% AVIATION PASSENGER OUTLOOK • 86% of airports polled (51 airports) expect enplanements to decline 40% or more in Calendar Year 2021. 46% predict a 50% or more decline. • 65% of airports polled state that overall passenger traffic will not reach 2019 till after 2024. 3 What is your estimated percent decrease of passenger enplanement at your airport in CY2020? 6% 8% 46% 40% 20-30% 31-40% 41-50% 50%+ STATS passengers 2020 were projected to increase by 8%, instead projected to be down 43% under slow recovery scenario 4 AVIATION OUTLOOK FY Q3 (Apr-Jun), enplaned passenger traffic forecasted to be down 94% versus 2019. FY Q4 (Jul-Sep), enplaned passenger traffic forecasted to be down 64% versus 2019. 5 STATS FY20 drop in enplanements estimated to be an unprecedented 43% Past economic recessions: (11.28%) AUS pax decline in 2002; (8.18%) decline in 2009 AUS recovers faster than the national average to pre- recession levels 6 AVIATION OPERATIONAL CHANGES Vehicle purchases put on hold Temporarily closed gates 1-6 and 29- 34 Reduced trash collection to closed gates Checkpoint reduction from 3 to 1 Shut down east and west baggage matrix – running bags thru oversize scanner Planning and Engineering building effectively shut down while employees work from home Employee Lot shut down and shuttle eliminated. Surface Lot consolidated into Lot B Valet operation shut down Ambassador Volunteer Program has been suspended Overflow TNC lot shut down 7 REVENUE Airline Revenue Impact Landing Fee Landing Weights dropped 60-70%; no pick up expected in FY20 Terminal Rental Rates & Other Fees Flights cancellations, drop in gate usage, drop in Remain Overnight Parking Non Airline Revenue Impact Significant drop in passengers of 97% Ground Transportation (Taxis, TNC) Significant drop in passengers of 95-97% Parking Rental Car Food, Beverage and Retail Concessions Advertising Other Rental and Fees Significant drop in passengers – Rental car companies looking for abatement relief Most concessions closed due to loss of passengers. Concessionaires seeking relief Ad inventory has “evaporated”. Drop in fuel flowage fees; Hotel not able to make rev share payments 8 AVIATION OPEX – COST REDUCTIONS Personnel • Hiring Freeze • Temporary employee reductions • Non critical overtime reductions • Seasonal employee reductions Commodities & Contractual • Travel and Training • Subscriptions • Advertising • Maintenance (from routine to condition based where applicable) • Consulting (eliminate, reduce or delay) • Contracts (reductions to parking: headcount, shuttling operation, overhead) • Supplies – Office, computer hardware/software, educational, clothing, tools & equipment 9 AVIATION EXPENSE OUTLOOK Expense reductions in response to passenger decline • For FY20, airport estimates airport related opex reductions of 22.7M versus budget, or 18%. • For FY21, cutting expenses further, by another 2.5% in response to reduced revenues. • No decreases to City overhead allocations in FY20 or FY21. 10 AVIATION CARES Act GRANT CARES Act funds determined in March before the full extent of air traffic losses known. AUS to receive - $58,735,130. Cares Act funds approximately 6 months worth of expenses. Not a lump sum amount. AUS will submit expenses for reimbursement. Can be used across fiscal years. Cannot be put into reserve funds. Any purpose that the airport revenue maybe lawfully used. Possible uses: Payroll, contracts, other operating expenses, debt service and airport development. 11